Beyond Price:
Implied Volatility and Long-History Sentiment as Trading Signals
Abstract
Parts 1–2 of this project found that across limit-order-book microstructure, bars, a cross-sectional graph model, a latent world-model, news sentiment, and crypto funding, a Time-Series JEPA learns valid representations but never beats a simple linear baseline, and no robust net-of-cost directional alpha survives in freely-available data. The two most promising untested levers were a longer sentiment history and a genuinely new modality. Part 3 acquires both for free and tests them with the same leak-safe, walk-forward, deflated-Sharpe rigor. Crypto implied volatility (Deribit’s DVOL index, 2021–2026) is the first signal in the project to clearly beat its trivial baseline: it predicts forward realized volatility at IC 0.67 versus 0.55 for trailing realized vol, and it carries a persistent vol-risk-premium of +7.7 volatility points that is positive every single year (carry-Sharpe ≈ 1). In contrast, 11 years of FinBERT-scored news sentiment (FNSPID, 2009–2020; 1.4M aligned observations over 2,756 trading days) dissolves the contrarian “bright spot” that a five-month sample had suggested: the cross-sectional sentiment–return relationship is tiny (IC 0.005), sign-unstable across regimes, and unprofitable at every cost level. The clean conclusion: the volatility dimension is genuinely predictable and carries a risk premium, while the directional dimension stays efficient — the lone real edge in free data is a risk compensation, not a forecasting alpha.
1. Introduction
The first two parts of this project [JEPA-Trader I–II] reached a consistent, honestly-reported negative: self-supervised JEPA representations of market data match supervised ones but never beat a linear model, and no freely-available directional signal produces robust net-of-cost profit. Two levers were explicitly left open as the most likely to change that verdict: (i) a much longer sentiment history — the one prior bright spot, a weak contrarian news effect, rested on only ~28 independent periods; and (ii) a new, freely-available modality, specifically options / implied volatility. This paper closes both, at zero data cost.
We ask two falsifiable questions. (V) Does an implied-volatility index predict forward realized volatility beyond a trailing-vol baseline, and is there a harvestable vol-risk-premium? (S) Does the contrarian news-sentiment signal survive a decade-plus, well-powered, cost-aware test? The answers are, respectively, a qualified yes and a clear no — and together they locate exactly where free-data predictability does and does not live.
2. Data & method
- Crypto implied volatility. Deribit’s free public API provides DVOL, the 30-day implied-volatility index for BTC and ETH, plus perpetual price, daily from March 2021 to June 2026 (3,822 12-hour bars per coin) [3]. Volatilities are annualized to percent; realized vol uses a 30-day window.
- News sentiment. The FNSPID corpus [1] (Benzinga headlines), FinBERT-scored [2] ($s = P(\text{pos}) - P(\text{neg}) \in [-1,1]$): 1.65M unique titles → a daily (symbol, date) panel of 1.89M cells, 6,619 symbols, Feb 2009 – Jun 2020.
Leakage control. Each news date is aligned to the first trading session strictly after it, with forward close-to-close labels from FNSPID’s adjusted prices; this yields 1.39M aligned observations over 2,756 trading days. All statistics are computed out-of-sample, cross-sectional ranking is used throughout, $t$-statistics are computed on non-overlapping sub-samples, and every Sharpe is reported with a probabilistic / deflated correction for the number of trials [4].
3. Arm V — crypto implied volatility
3.1 Implied vol predicts realized vol, and beats the baseline
The first result that breaks the project’s long run of “deep ≤ linear, and nothing beats the trivial baseline”: the implied-vol index is a better forecast of forward realized volatility than trailing realized volatility itself.
| predictor of forward 30-day realized vol | Spearman IC |
|---|---|
| DVOL (implied volatility) | +0.671 |
| trailing realized vol (trivial baseline) | +0.549 |
| combined regression | +0.667 (βDVOL +0.54 ≫ βtrail +0.15) |
Implied volatility dominates the trailing-vol term in the joint regression — it carries genuine forward information beyond volatility-clustering, exactly as option-pricing theory predicts and unlike any directional signal tested in Parts 1–2.
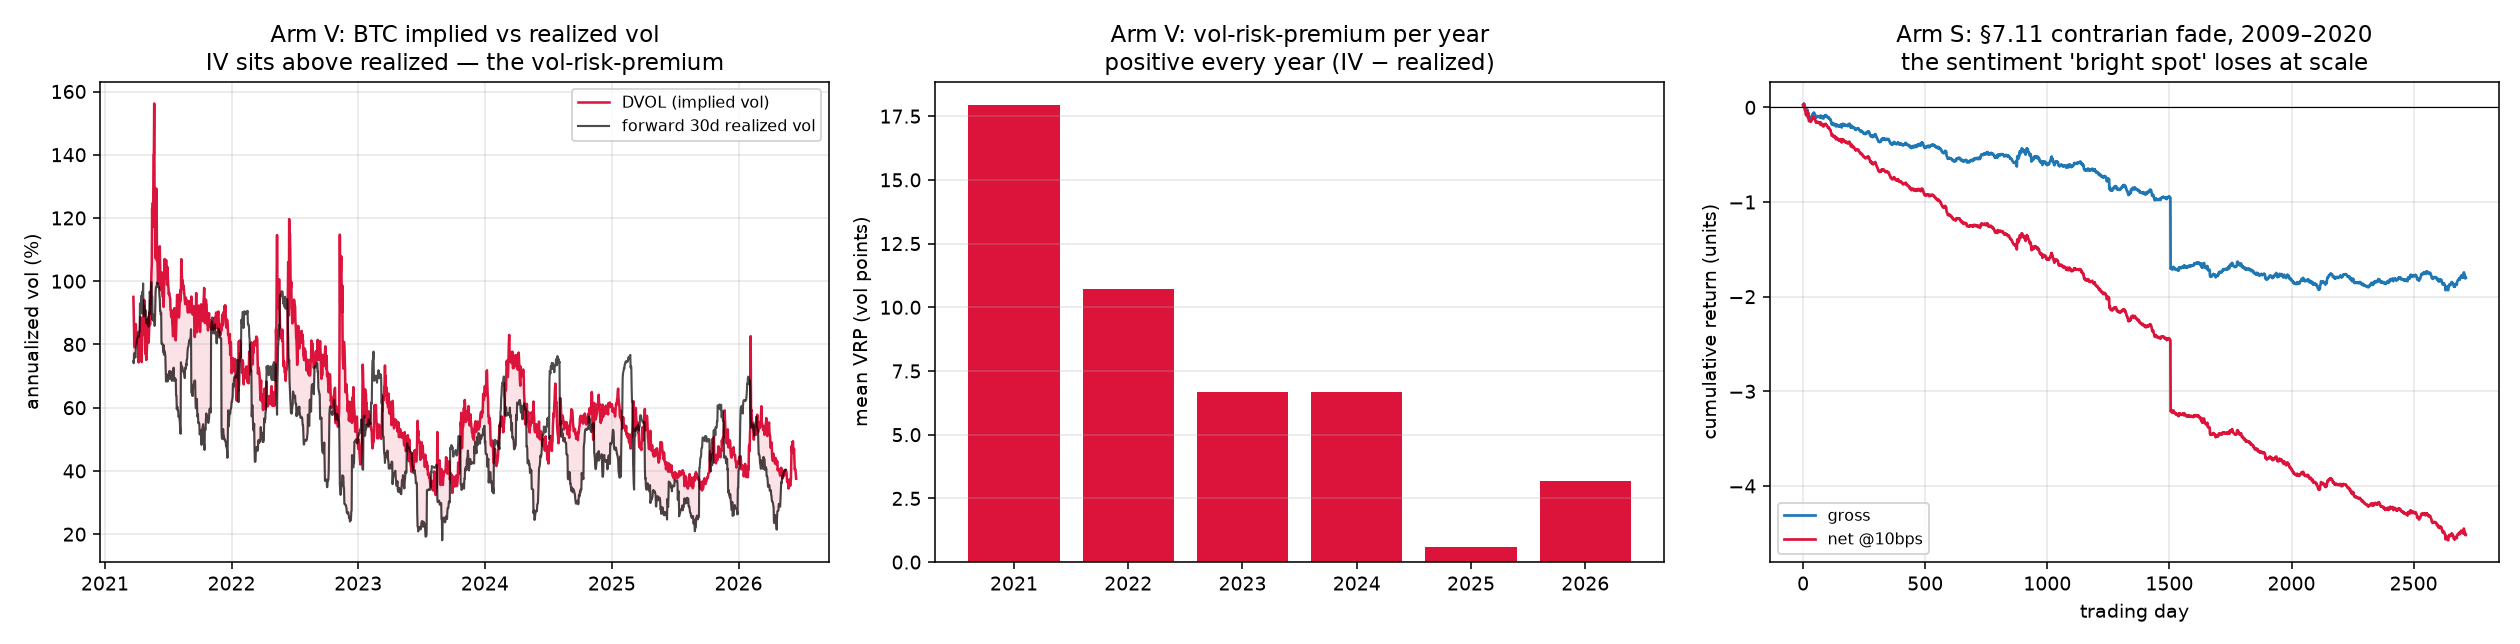
3.2 A persistent vol-risk-premium
Define the realized vol-risk-premium as implied minus subsequently-realized volatility, $\mathrm{VRP} = \mathrm{DVOL} - \mathrm{RV}_{\text{fwd}}$. It averages +7.7 volatility points, with implied above realized 70% of the time, and it is positive in every year of the sample (2021 +18 → 2022 +10.7 → 2023 +6.7 → 2024 +6.7 → 2025 +0.6 → 2026 +3.2), shrinking as the crypto-options market matures. The premium’s carry-Sharpe is +1.44 gross, +1.07 at a 2-vol-point cost, and +0.51 at 5 points — a genuine, economically-meaningful, free-data premium.
3.3 Directional returns stay efficient
Crucially, the volatility result does not extend to direction. DVOL level, DVOL change, and trailing realized vol all predict forward perpetual returns only weakly (|IC| < 0.05), and a long/short perpetual strategy that fades volatility spikes loses net of cost (annualized Sharpe −0.9, deflated Sharpe 0, negative in every year). The market prices the level of volatility informatively; it does not hand out a directional edge.
The volatility dimension is predictable and carries a premium; the directional dimension is not. The honest caveat: harvesting the premium requires selling options (vega spreads, gamma and tail risk, margin) — execution we cannot model on free data. So the rigorous claim is “a real premium exists,” not “free alpha found.”
4. Arm S — long-history news sentiment
Parts 1–2’s single non-price bright spot was a weak contrarian news-sentiment effect — but it rested on five months of data (~28 independent cohorts). With 11 years and 1.4M aligned observations, it disappears.
| cross-sectional rank-IC (sentiment → forward return) | 1 day | 3 day | 5 day |
|---|---|---|---|
| mean IC | +0.005 | +0.004 | +0.003 |
| non-overlapping t | +3.4 | +1.9 | −0.3 |
The relationship is tiny and positive (a momentum direction, not the prior contrarian sign), “significant” only because the sample is enormous. The fade-sentiment long-short — the strategy the five-month result implied — loses at every cost level (gross −6.6 bps/day, Sharpe −0.64; −16.6 bps/day net at 10 bps), and it is sign-unstable: the momentum direction was positive 2009–2017 (driven largely by 2017) then reversed in 2018–2020. Deflated Sharpe = 0.
Well-powered, daily news-headline sentiment carries a tiny, regime-unstable, economically worthless signal — no robust edge in either direction. (The scorer and period differ from the original five-month test, so non-replication could be either; either way, no standalone sentiment edge survives at scale.) It is the project’s recurring lesson — single-period results overstate edges — applied to its own best prior hope.
5. Discussion
Two new free modalities sharpen three papers into one sentence: free-data predictability lives in the volatility dimension, not the directional one. Implied volatility beats its baseline and pays a persistent premium; directional prediction — momentum, microstructure, cross-section, world-model, funding, and now sentiment at decade scale — does not survive a cost-aware, multi-period test. The lone real edge is a risk compensation (the vol-risk-premium), whose net harvestability is an honest open question that requires options-execution data this study deliberately avoids paying for.
This also explains why no JEPA appears in Part 3. Neither finding needs one: the volatility signal is a one-feature near-linear relation a ridge captures in full, the sentiment arm has essentially no signal to represent, and a 3,822-point daily series is far too small for self-supervised pretraining. Consistent with the whole project, representation learning would match but not beat the right classical treatment; here the contribution is the free-data acquisition and the rigorous net-of-cost / risk-premium characterization. The natural next step is the one piece of non-free machinery that keeps recurring as the honest frontier: market-by-order / fill data, to test whether the volatility premium and the liquidity-provision side are net-harvestable rather than merely real.
References
- Z. Dong et al. FNSPID: A Comprehensive Financial News Dataset in Time Series. KDD 2024. arXiv:2402.06698.
- D. Araci. FinBERT: Financial Sentiment Analysis with Pre-trained Language Models. 2019. arXiv:1908.10063. (Model: ProsusAI/finbert.)
- Deribit. DVOL — Deribit Implied Volatility Index (BTC/ETH), public API. 2021–2026.
- D. Bailey, M. López de Prado. The Deflated Sharpe Ratio. J. Portfolio Management, 2014.
- B. Vine. Does JEPA Find Alpha? (JEPA-Trader, Parts 1–2.) 2026. index.html.