<?xml version="1.0" encoding="utf-8"?><feed xmlns="http://www.w3.org/2005/Atom" ><generator uri="https://jekyllrb.com/" version="4.4.1">Jekyll</generator><link href="https://bryanvine.github.io/turboquant-xpu/feed.xml" rel="self" type="application/atom+xml" /><link href="https://bryanvine.github.io/turboquant-xpu/" rel="alternate" type="text/html" /><updated>2026-07-06T21:57:17+00:00</updated><id>https://bryanvine.github.io/turboquant-xpu/feed.xml</id><title type="html">turboquant-xpu notes</title><subtitle>Research notes on LLM inference performance on Intel Arc GPUs. Speculative decoding, KV cache quantization, custom kernels.</subtitle><author><name>Bryan Vine</name></author><entry><title type="html">vLLM 0.21.1.dev’s FlashAttention + fp8 KV vs TurboQuant on Arc Pro B70: characterized, then migrated</title><link href="https://bryanvine.github.io/turboquant-xpu/2026/07/04/upstream-flashattention-fp8-vs-turboquant-b70/" rel="alternate" type="text/html" title="vLLM 0.21.1.dev’s FlashAttention + fp8 KV vs TurboQuant on Arc Pro B70: characterized, then migrated" /><published>2026-07-04T12:00:00+00:00</published><updated>2026-07-04T12:00:00+00:00</updated><id>https://bryanvine.github.io/turboquant-xpu/2026/07/04/upstream-flashattention-fp8-vs-turboquant-b70</id><content type="html" xml:base="https://bryanvine.github.io/turboquant-xpu/2026/07/04/upstream-flashattention-fp8-vs-turboquant-b70/"><![CDATA[<h2 id="tldr">TL;DR</h2>

<ul>
  <li><strong>Ran the head-to-head, then didn’t wait for a follow-up post to act on it.</strong> The plan going in was “characterize, defer the migrate verdict” — benchmark upstream <code class="language-plaintext highlighter-rouge">intel/vllm:latest</code> (compressed-tensors W4A16 + fp8 paged KV + the XPU <code class="language-plaintext highlighter-rouge">FLASH_ATTN</code> backend) against the production 0.19 + patched-GPTQ + TurboQuant stack on the Arc Pro B70, ship the numbers, decide later. The numbers came in clear enough that “later” happened the same session: <strong>production is now running the new stack.</strong> The old stack (TQ 0.19) is preserved as a one-command rollback.</li>
  <li><strong>This is a stack-vs-stack comparison, not an isolated FlashAttention microbenchmark.</strong> Attention backend, weight quant (GPTQ → W4A16), and KV scheme (TurboQuant → fp8) all changed at once. None of the numbers below isolate cleanly to “FlashAttention did this” — saying so up front, not burying it in the limits section.</li>
  <li><strong>The upstream image is vLLM <code class="language-plaintext highlighter-rouge">0.21.1.dev17+g0a4756bb5</code>, not 0.23.</strong> <code class="language-plaintext highlighter-rouge">intel/vllm:latest</code> tracks a rolling dev branch; there’s no numbered 0.23 release inside it, despite that being this whole spike’s working title going in.</li>
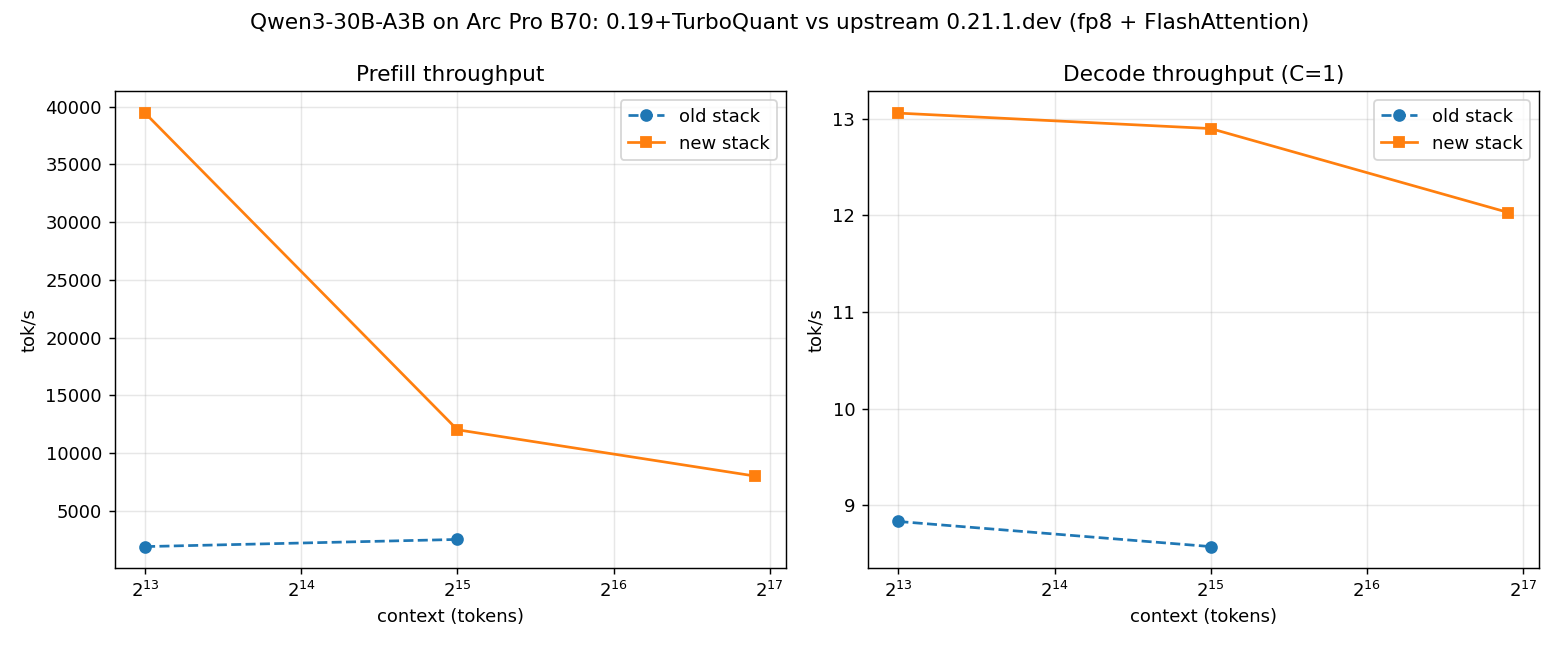
  <li><strong>Prefill: ~20x faster at 8K context, ~4.7x at 32K</strong> (1,929 → 39,430 tok/s @8K; 2,547 → 12,035 tok/s @32K, C=1, no draft either side). <strong>Decode: only ~1.5x</strong> (8.6–8.8 → 12–13 tok/s) — this MoE’s decode is bandwidth-bound on expert-weight loads, not attention, so a faster attention kernel barely touches it.</li>
  <li><strong>fp8 KV holds ~40% less aggregate cache than TurboQuant</strong> (270,592 vs 453,184 tokens, both measured) — that gap, not the context ceiling, is the real bill for the speedup. The single-request ceiling as deployed that day was a conservative 131K; it went back up to 262K within 24 hours once tested (see the Update near the end of this post).</li>
  <li><strong>Neither stack is stock.</strong> The old stack needs its patched <code class="language-plaintext highlighter-rouge">gptq.py</code> to boot on XPU at all; the “upstream” new stack needed its own bind-mounted <code class="language-plaintext highlighter-rouge">marlin_utils.py</code> carve-out, because it routes W4A16 MoE to a CUDA-only Marlin kernel that isn’t compiled for XPU. Both ship on a patch.</li>
  <li><strong>Follow-up — can the upgraded stack run the newer hybrid models (Qwen3.5 / 3.6)?</strong> The native XPU Gated-DeltaNet kernel that needed a hand-built image back in April now ships in the box. But both 35B-A3B hybrids get forced onto <code class="language-plaintext highlighter-rouge">--enforce-eager</code> (torch.compile hangs on the GDN layers), which roughly halves throughput: Qwen3.5-GPTQ works but is a fragile, verbose <em>thinking</em> model at ~7.3 tok/s C=1 (~½ the 30B), and the one runnable Qwen3.6 checkpoint generates garbage. Kept the 30B. See the Qwen3.5/3.6 follow-up near the end of this post.</li>
  <li><strong>Follow-up — the speculative-decoding call above was wrong; EAGLE-3 now ships.</strong> The Update’s “EAGLE3 is a dead end” verdict was a config bug, not a model limit: the draft’s <code class="language-plaintext highlighter-rouge">config.json</code> capped <code class="language-plaintext highlighter-rouge">max_position_embeddings</code> at 2048, zeroing acceptance above that. One-field fix — then a captured <em>day of real traffic</em> settled it. The workload is ~99% novel structured-JSON output (not the repetitive-input case ngram wins), so EAGLE-3 beats ngram <strong>1.6x @C=1 / 1.4x @C=4</strong> and replaced it in production. See the 2026-07-06 follow-up near the end.</li>
  <li>Fourth post in the <a href="https://bryanvine.github.io/turboquant-xpu/">Arc B70 series</a>. Previous posts: <a href="/turboquant-xpu/2026/04/14/spec-decode-intel-arc/">the first SYCL PoC + 2x Triton fix</a>, <a href="/turboquant-xpu/2026/04/15/sycl-three-attempts-arc-b70/">three SYCL attempts and the gap to Triton</a>, <a href="/turboquant-xpu/2026/04/16/qwen3-30b-tq-suffix-c1/">TurboQuant + EAGLE3, six integration fixes</a>.</li>
</ul>

<h2 id="why-now-the-frontier-moved">Why now: the frontier moved</h2>

<p>DeepSeek V4 shipped April 24, 2026, and cut its KV cache to roughly 10% of V3.2’s footprint by training in Compressed Sparse Attention, Heavily Compressed Attention, and DSA — architecture-level attention tricks that make long-context serving dramatically cheaper, if you can run them. This box can’t. V4 is 284B+ parameters, and the fast paths (FlashMLA, FlashInfer) are CUDA-only; none of it touches a 32 GiB Arc Pro B70. So V4 isn’t this post’s subject — it’s the reason to go looking for what frontier move a B70 actually <em>can</em> ride. The answer was sitting in the changelogs: <code class="language-plaintext highlighter-rouge">vllm-xpu-kernels</code> shipped a real FlashAttention implementation for Battlemage — XMX/DPAS-targeted kernels for both prefill and paged decode — plus fp8 paged KV, and it landed in upstream <code class="language-plaintext highlighter-rouge">intel/vllm</code>. That’s not V4’s 90% KV cut. It’s the actual, runnable-today upgrade available to this card, and it’s what the rest of this post measures.</p>

<h2 id="the-two-stacks">The two stacks</h2>

<p>Three things changed between the stack that was serving production yesterday and the one serving it now:</p>

<table>
  <thead>
    <tr>
      <th> </th>
      <th>Old stack (production until today)</th>
      <th>New stack (production now)</th>
    </tr>
  </thead>
  <tbody>
    <tr>
      <td>Image</td>
      <td><code class="language-plaintext highlighter-rouge">vllm-xpu:0.19.0-tr5</code>, self-built, patched <code class="language-plaintext highlighter-rouge">gptq.py</code></td>
      <td><code class="language-plaintext highlighter-rouge">intel/vllm:latest</code> = vLLM <code class="language-plaintext highlighter-rouge">0.21.1.dev17+g0a4756bb5</code></td>
    </tr>
    <tr>
      <td>Weight quant</td>
      <td>Qwen3-30B-A3B GPTQ-Int4</td>
      <td>Qwen3-30B-A3B compressed-tensors W4A16</td>
    </tr>
    <tr>
      <td>KV cache</td>
      <td>TurboQuant <code class="language-plaintext highlighter-rouge">k3v4_nc</code> — 453,184 tokens measured @ 262,144 max-len</td>
      <td>fp8 paged — 270,592 tokens measured @ 131,072 max-len</td>
    </tr>
    <tr>
      <td>Attention</td>
      <td>eager tiled online-softmax, O(N²) prefill wall</td>
      <td>upstream XPU <code class="language-plaintext highlighter-rouge">FLASH_ATTN</code> backend (FlashAttention v2, “sycl-tla FMHA” kernels)</td>
    </tr>
    <tr>
      <td>Speculative decoding</td>
      <td>suffix (production-tuned)</td>
      <td>none — not integrated</td>
    </tr>
    <tr>
      <td>dtype</td>
      <td>float16</td>
      <td>float16</td>
    </tr>
    <tr>
      <td>Load-bearing patch</td>
      <td><code class="language-plaintext highlighter-rouge">gptq.py</code> XPU fix + TurboQuant’s monkey-patch/mount layer</td>
      <td><code class="language-plaintext highlighter-rouge">marlin_utils.py</code> XPU carve-out</td>
    </tr>
  </tbody>
</table>

<p><em>Two details in the right-hand column above went stale within a day: the max-len value in the KV-cache row (131,072 → 262,144; the pool size itself, 270,592, didn’t move) and the speculative-decoding row both changed. See the Update near the end of this post.</em></p>

<p>Every row moved together — this is a <strong>stack-vs-stack</strong> comparison, not a controlled FlashAttention-only experiment. The ~20x prefill number a few sections down reflects the attention-backend switch <em>and</em> the quant-format switch <em>and</em> the KV-scheme switch, all landing in the same container image at once. There’s no ablation in this dataset that isolates FlashAttention’s individual contribution, and I’m not going to write around that.</p>

<p>The pre-spike plan also assumed the new stack would land close to stock upstream, with the old stack carrying all the patch debt. It didn’t work out that clean. Getting W4A16 MoE to actually run on XPU needed a source patch of its own (below) — so the honest framing is <strong>patch-vs-patch</strong>, not patch-vs-stock.</p>

<h2 id="what-it-took-to-run-upstream-on-the-b70">What it took to run upstream on the B70</h2>

<p><code class="language-plaintext highlighter-rouge">intel/vllm:latest</code> is not a drop-in swap. Four fixes were needed before it would serve a single token on this box — three Compose/Docker plumbing issues and one source patch.</p>

<h3 id="1-the-entrypoint-eats-a-bare-command-list">1. The entrypoint eats a bare command list</h3>

<p><code class="language-plaintext highlighter-rouge">intel/vllm:latest</code>’s <code class="language-plaintext highlighter-rouge">ENTRYPOINT</code> is <code class="language-plaintext highlighter-rouge">["/bin/bash", "-c", "source /opt/intel/oneapi/setvars.sh --force &amp;&amp; exec \"$@\"", "--"]</code> — a <code class="language-plaintext highlighter-rouge">bash -c script -- "$@"</code> wrapper. The trailing <code class="language-plaintext highlighter-rouge">--</code> is consumed as <code class="language-plaintext highlighter-rouge">$0</code>; whatever <code class="language-plaintext highlighter-rouge">command:</code> says becomes <code class="language-plaintext highlighter-rouge">"$@"</code> and gets <code class="language-plaintext highlighter-rouge">exec</code>‘d verbatim. There is no implicit <code class="language-plaintext highlighter-rouge">vllm serve</code> anywhere. A <code class="language-plaintext highlighter-rouge">command:</code> of bare flags (<code class="language-plaintext highlighter-rouge">--model foo ...</code>, no program name) fails with <code class="language-plaintext highlighter-rouge">exec: --: invalid option</code> — confirmed empirically (<code class="language-plaintext highlighter-rouge">docker run intel/vllm:latest vllm serve --help</code> reaches vLLM’s own argparse; the bare-flags form doesn’t). Fix: <code class="language-plaintext highlighter-rouge">command:</code> starts with <code class="language-plaintext highlighter-rouge">vllm</code>, <code class="language-plaintext highlighter-rouge">serve</code>.</p>

<h3 id="2-env_file-doesnt-feed-composes-own-var-interpolation">2. <code class="language-plaintext highlighter-rouge">env_file:</code> doesn’t feed Compose’s own <code class="language-plaintext highlighter-rouge">${VAR}</code> interpolation</h3>

<p>The compose file’s <code class="language-plaintext highlighter-rouge">command:</code> needed <code class="language-plaintext highlighter-rouge">"${VLLM023_MODEL}"</code>. <code class="language-plaintext highlighter-rouge">env_file:</code> only injects variables into the <em>container’s</em> runtime environment; Compose’s own <code class="language-plaintext highlighter-rouge">${VAR}</code> YAML interpolation reads shell env or a <code class="language-plaintext highlighter-rouge">.env</code> file in the compose project directory — it never sees <code class="language-plaintext highlighter-rouge">env_file:</code> contents. Caught via <code class="language-plaintext highlighter-rouge">docker compose config</code> (dry run) before ever booting for real: it rendered <code class="language-plaintext highlighter-rouge">--model ""</code>. Fix: added <code class="language-plaintext highlighter-rouge">deploy/.env</code> alongside the pre-existing <code class="language-plaintext highlighter-rouge">deploy/vllm023.env</code> (kept, still used for the container’s own runtime env).</p>

<h3 id="3-group_add-render-video-fails--the-image-has-no-render-group">3. <code class="language-plaintext highlighter-rouge">group_add: [render, video]</code> fails — the image has no <code class="language-plaintext highlighter-rouge">render</code> group</h3>

<div class="language-plaintext highlighter-rouge"><div class="highlight"><pre class="highlight"><code>Error response from daemon: Unable to find group render: no matching entries in group file
</code></pre></div></div>

<p>Docker resolves <code class="language-plaintext highlighter-rouge">group_add</code> <em>names</em> against the image’s own <code class="language-plaintext highlighter-rouge">/etc/group</code>, and this image’s <code class="language-plaintext highlighter-rouge">/etc/group</code> only defines <code class="language-plaintext highlighter-rouge">video</code> (gid 44) — no <code class="language-plaintext highlighter-rouge">render</code> entry. What actually matters for <code class="language-plaintext highlighter-rouge">/dev/dri</code> access is the <em>host’s</em> numeric gid that owns the bind-mounted device nodes (<code class="language-plaintext highlighter-rouge">render=992</code>, <code class="language-plaintext highlighter-rouge">video=44</code> on this box). Fix: numeric gids instead of names — sidesteps the missing entry, and is arguably more portable in general.</p>

<h3 id="4-upstream-routes-w4a16-moe-to-a-cuda-only-marlin-kernel-on-xpu">4. Upstream routes W4A16 MoE to a CUDA-only Marlin kernel on XPU</h3>

<p>After fixes 1–3 the container booted and loaded weights, then EngineCore crashed:</p>

<div class="language-plaintext highlighter-rouge"><div class="highlight"><pre class="highlight"><code>AttributeError: '_OpNamespace' '_C' object has no attribute 'gptq_marlin_repack'
</code></pre></div></div>

<p>Root cause, from the source: <code class="language-plaintext highlighter-rouge">marlin_utils.py::check_moe_marlin_supports_layer()</code> excludes only ROCm —</p>

<div class="language-plaintext highlighter-rouge"><div class="highlight"><pre class="highlight"><code>if current_platform.is_rocm():
    return False
</code></pre></div></div>

<p>— so on XPU it still returns <code class="language-plaintext highlighter-rouge">True</code>, and <code class="language-plaintext highlighter-rouge">compressed_tensors_moe.py</code> routes W4A16 MoE to <code class="language-plaintext highlighter-rouge">CompressedTensorsWNA16MarlinMoEMethod</code>, which calls a Marlin repack op that was never compiled into the XPU <code class="language-plaintext highlighter-rouge">_C</code> extension. No env-var escape hatch exists (checked <code class="language-plaintext highlighter-rouge">VLLM_MARLIN_USE_ATOMIC_ADD</code>, <code class="language-plaintext highlighter-rouge">VLLM_MARLIN_INPUT_DTYPE</code>, <code class="language-plaintext highlighter-rouge">VLLM_MXFP4_USE_MARLIN</code>, <code class="language-plaintext highlighter-rouge">VLLM_TEST_FORCE_FP8_MARLIN</code> — none apply; the platform check is the only gate). Fix: bind-mounted a corrected <code class="language-plaintext highlighter-rouge">marlin_utils.py</code> adding <code class="language-plaintext highlighter-rouge">or current_platform.is_xpu()</code>, mirroring the existing ROCm carve-out — the same mount-a-corrected-file pattern the old stack already uses for its <code class="language-plaintext highlighter-rouge">gptq.py</code> patch. After the fix: <code class="language-plaintext highlighter-rouge">Using CompressedTensorsWNA16MoEMethod</code> (the portable, non-Marlin path) and a clean boot through to serving.</p>

<p>Once the container could start at all, none of this touched attention-backend selection or KV-cache dispatch — those worked as hoped, unforced. Boot took <strong>~3m51s</strong> cold (torch.compile 82.14s + profiling/warmup 24.09s included); a 1-token smoke test returned “Paris,” and a 40-token haiku coherence check came back well-formed and on-topic, ruling out silent numeric corruption in the W4A16/fp8/FlashAttention combination. Dispatch confirmed from the container logs:</p>

<div class="language-plaintext highlighter-rouge"><div class="highlight"><pre class="highlight"><code>[cache.py:261] Using fp8 data type to store kv cache. It reduces the GPU memory footprint...
[xpu.py:96] Using Flash Attention backend.
[flash_attn.py:641] Using FlashAttention version 2
[compressed_tensors_moe.py:113] Using CompressedTensorsWNA16MoEMethod
[kv_cache_utils.py:1710] GPU KV cache size: 270,592 tokens
[kv_cache_utils.py:1711] Maximum concurrency for 131,072 tokens per request: 2.06x
</code></pre></div></div>

<p><code class="language-plaintext highlighter-rouge">FLASH_ATTN</code> dispatched on its own (<code class="language-plaintext highlighter-rouge">--attention-backend</code> was intentionally left unset), and fp8 KV did <strong>not</strong> force a fallback to a different backend — that specific combination was a known regression risk carried over from the 0.19 experience, and it didn’t recur here.</p>

<p>One honest caveat on the “XMX” half of “XMX FlashAttention”: the literal strings <code class="language-plaintext highlighter-rouge">xmx</code> and <code class="language-plaintext highlighter-rouge">dpas</code> do not appear anywhere in this image’s Python source (<code class="language-plaintext highlighter-rouge">grep -r</code> over the full <code class="language-plaintext highlighter-rouge">vllm</code> package tree — zero hits for both). <code class="language-plaintext highlighter-rouge">platforms/xpu.py</code> describes the kernel as “FMHA sycl-tla kernels,” and the actual attention math runs inside the compiled <code class="language-plaintext highlighter-rouge">vllm_xpu_kernels</code> package — SYCL, not Python — which, per this project’s own prior BMG-G31 findings (<code class="language-plaintext highlighter-rouge">joint_matrix</code> blocked on stock oneAPI 2025.3, ESIMD <code class="language-plaintext highlighter-rouge">xmx::dpas</code> as the working substitute), is the plausible mechanism underneath “sycl-tla.” But I did not disassemble the compiled kernel to confirm <code class="language-plaintext highlighter-rouge">dpas</code> instructions at the ISA level. What’s confirmed: the real <code class="language-plaintext highlighter-rouge">FLASH_ATTN</code> backend dispatched, not an eager/SDPA/CPU fallback. What’s not independently confirmed: ISA-level proof that it’s issuing XMX/DPAS underneath. Calling it XMX/DPAS by the kernel library’s design, not by verification.</p>

<h2 id="bench-matrix">Bench matrix</h2>

<p>C=1 unless noted, 5-prompt amortization, prefix caching on, <code class="language-plaintext highlighter-rouge">--dtype float16</code> on both stacks. Same 16-prompt mixed set (code / math / translation / prose / QA) as the April posts, truncated to 5. Harness: <code class="language-plaintext highlighter-rouge">scripts/bench_vllm023.py</code> — new, and unlike <code class="language-plaintext highlighter-rouge">bench_c1_context.py</code>, it separates prefill and decode instead of conflating them into one tok/s number.</p>

<p><img src="/turboquant-xpu/assets/vllm023_compare_2026-07-04.png" alt="Prefill and decode throughput: old TurboQuant stack vs new upstream stack" /></p>

<table>
  <thead>
    <tr>
      <th>metric</th>
      <th style="text-align: right">ctx</th>
      <th style="text-align: right">old (tok/s)</th>
      <th style="text-align: right">new (tok/s)</th>
      <th style="text-align: right">new/old</th>
    </tr>
  </thead>
  <tbody>
    <tr>
      <td>prefill</td>
      <td style="text-align: right">8,192</td>
      <td style="text-align: right">1,929.28</td>
      <td style="text-align: right">39,429.77</td>
      <td style="text-align: right">20.4x</td>
    </tr>
    <tr>
      <td>prefill</td>
      <td style="text-align: right">32,768</td>
      <td style="text-align: right">2,546.79</td>
      <td style="text-align: right">12,034.88</td>
      <td style="text-align: right">4.7x</td>
    </tr>
    <tr>
      <td>prefill</td>
      <td style="text-align: right">122,880</td>
      <td style="text-align: right">not measured</td>
      <td style="text-align: right">8,028.75</td>
      <td style="text-align: right">—</td>
    </tr>
    <tr>
      <td>prefill</td>
      <td style="text-align: right">131,072</td>
      <td style="text-align: right"><strong>CITED</strong>, not re-run — ~20 min cold, O(N²) eager</td>
      <td style="text-align: right">not tested at this exact ctx</td>
      <td style="text-align: right">—</td>
    </tr>
    <tr>
      <td>decode (C=1)</td>
      <td style="text-align: right">8,192</td>
      <td style="text-align: right">8.83</td>
      <td style="text-align: right">13.06</td>
      <td style="text-align: right">1.5x</td>
    </tr>
    <tr>
      <td>decode (C=1)</td>
      <td style="text-align: right">32,768</td>
      <td style="text-align: right">8.57</td>
      <td style="text-align: right">12.90</td>
      <td style="text-align: right">1.5x</td>
    </tr>
    <tr>
      <td>decode (C=1)</td>
      <td style="text-align: right">122,880</td>
      <td style="text-align: right">not measured</td>
      <td style="text-align: right">12.03</td>
      <td style="text-align: right">—</td>
    </tr>
    <tr>
      <td>decode (C=1)</td>
      <td style="text-align: right">131,072</td>
      <td style="text-align: right"><strong>CITED</strong>, not re-run — ~flat vs context, bandwidth-bound MoE</td>
      <td style="text-align: right">not tested at this exact ctx</td>
      <td style="text-align: right">—</td>
    </tr>
    <tr>
      <td>aggregate (C=12, ctx 8,192)</td>
      <td style="text-align: right">—</td>
      <td style="text-align: right">15.21 (production suffix draft)</td>
      <td style="text-align: right">110.92 (no draft)</td>
      <td style="text-align: right">not apples-to-apples — see Surprises</td>
    </tr>
  </tbody>
</table>

<p>The two <strong>CITED</strong> old-stack rows at 131,072 are exactly that: cited from this project’s known historical risk profile, not re-run this session. Reaching 128K-class context on the old stack requires the ~20-minute cold eager prefill that’s the documented wedge risk for this box; the decode figure is cited as “roughly flat vs. context” because this MoE’s C=1 decode is bandwidth-bound on expert-weight loads rather than attention — a pattern the <em>measured</em> new-stack decode row confirms independently (13.06 → 12.90 → 12.03 tok/s across 8K→32K→123K, an ~8% drop over a 15x increase in context).</p>

<p>The prefill gap almost certainly widens past what’s measured here, not narrows. The old stack’s own trend from 8K to 32K actually ticks <em>up</em> slightly (1,929 → 2,547 tok/s — likely fixed per-request overhead amortizing over more tokens), but the cited ~20-minute cold prefill at 131,072 is only consistent with O(N²) eager attention cost overtaking that trend hard somewhere past 32K. We didn’t re-run that cell to get an exact number — that’s the point of citing it instead of guessing — but there’s no reading of “20 minutes for one prompt” that keeps the old stack within shouting distance of the new stack’s measured 8,028.75 tok/s at 122,880.</p>

<h2 id="surprises">Surprises</h2>

<ul>
  <li><strong>fp8’s measured KV budget (270,592 tokens) beat the pre-spike estimate (~207K) by about 30%.</strong> The plan’s back-of-envelope number came from a June changelog scan; the real number, read straight off <code class="language-plaintext highlighter-rouge">kv_cache_utils.py</code>’s boot-time log line, is meaningfully better.</li>
  <li><strong>FlashAttention + fp8 KV coexisted without a forced fallback.</strong> This was the specific thing worth checking, because the 0.19 stack has a known history of KV-dtype changes silently knocking attention onto a slower backend. <code class="language-plaintext highlighter-rouge">--attention-backend</code> was left unset on purpose; XPU picked <code class="language-plaintext highlighter-rouge">FLASH_ATTN</code> on its own and fp8 didn’t move it. Confirmed, not assumed — this was worth being nervous about going in.</li>
  <li><strong>The old stack’s aggregate C=12 number (15.21 tok/s, production suffix draft) is barely above its own C=1 no-draft decode number (8.83 tok/s) — only ~1.7x for 12x the concurrency.</strong> The new stack’s C=12 no-draft number (110.92 tok/s) is ~8.5x over its own C=1 no-draft decode (13.06). Different draft configs, so this isn’t a clean comparison (flagged in the table above), but the shape is real: <code class="language-plaintext highlighter-rouge">switch-model.sh</code>’s own production comments note suffix decoding is tuned for low-concurrency interactive latency and “deadlocks on XPU at C≥16” — consistent with per-request tree-verification overhead not scaling once the GPU is already compute-saturated by concurrent streams.</li>
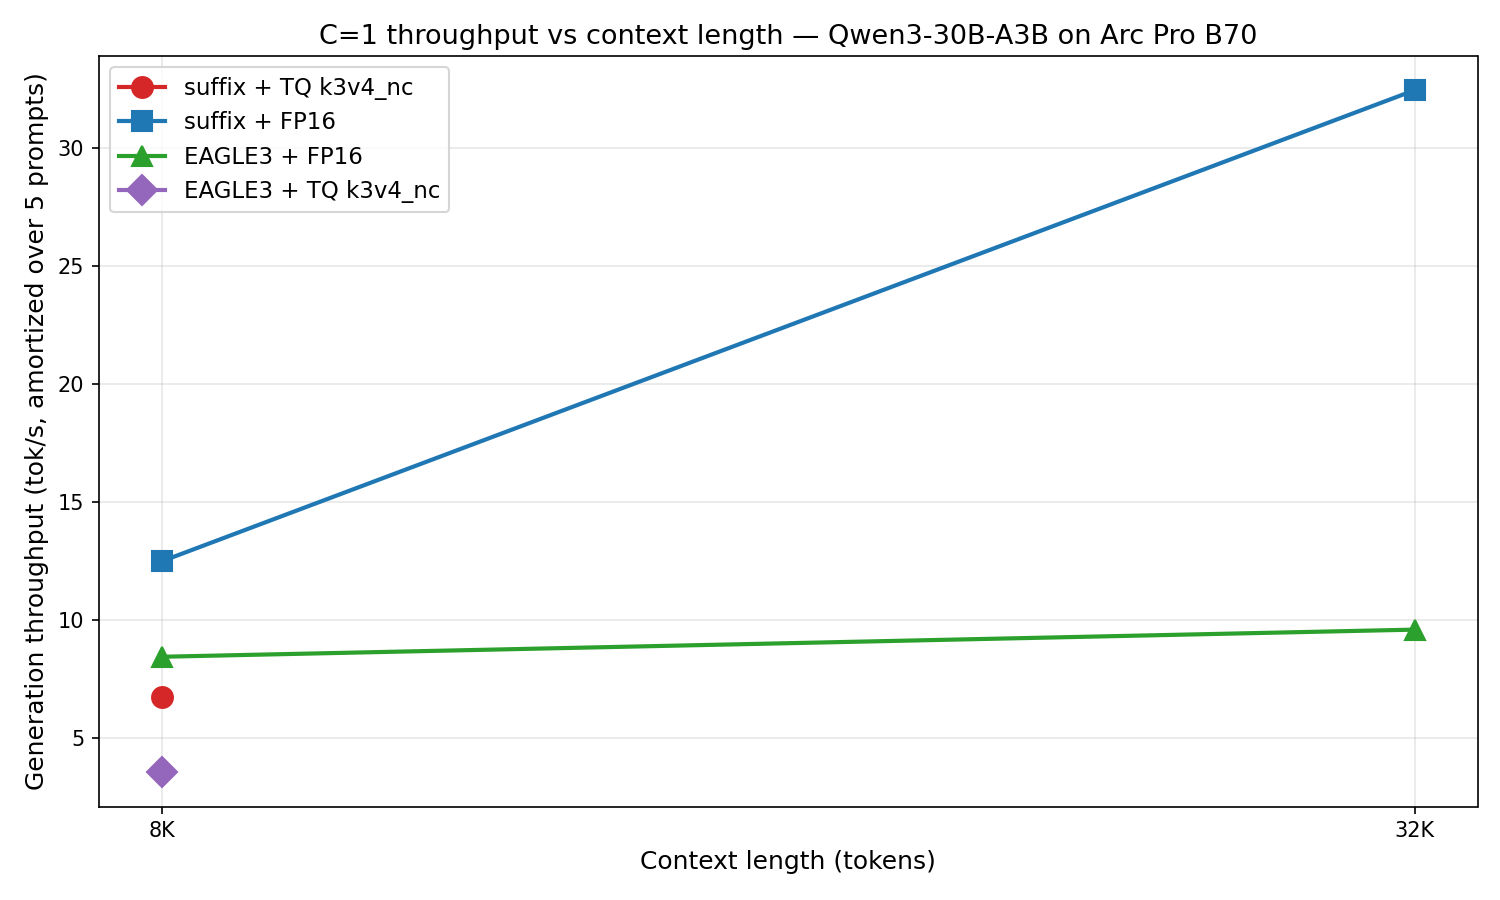
  <li><strong>That also means “old stack decode is 8.8 tok/s” undersells old-stack production on the right workload.</strong> The 8.83 figure is the no-draft, isolate-the-variable number used for the head-to-head table above. Actual old-stack production runs suffix decoding, and on repetitive content the April 16 post measured suffix+FP16 hitting <strong>32.44 tok/s at 32K</strong> — the suffix tree loves repeated system-prompt padding. So the honest decode comparison depends heavily on the prompt: on fresh, non-repetitive content the new stack’s flat ~13 tok/s likely wins outright; on a stable system prompt or a cached document, the old stack’s suffix decoding could still be competitive or ahead, at 40% less KV headroom. Neither side had a speculative-decoding story on the new stack at the time; ngram closes part of that gap as of the next day (see the Update below), though it’s prompt-lookup rather than a trained draft model, and this specific repetitive-content/C=12 comparison hasn’t been rerun with it.</li>
  <li><strong>The integration cost dropped, but didn’t hit zero.</strong> TurboQuant needed six historical fixes on the old stack (a Python 3.12 <code class="language-plaintext highlighter-rouge">find_spec</code> deprecation, dataclass <code class="language-plaintext highlighter-rouge">Field.type</code> patching, worker re-import, a <code class="language-plaintext highlighter-rouge">cwd</code>-shadowed import, a missing backend-registry enum, and a <code class="language-plaintext highlighter-rouge">--max-num-seqs</code> KV-sizing footgun). The new stack needed four, one of them a source patch. Less debt, not no debt.</li>
</ul>

<h2 id="the-tradeoff-and-the-call-i-made">The tradeoff, and the call I made</h2>

<table>
  <thead>
    <tr>
      <th>dimension</th>
      <th>old stack (TQ 0.19)</th>
      <th>new stack (upstream)</th>
    </tr>
  </thead>
  <tbody>
    <tr>
      <td><strong>Speed</strong></td>
      <td>Prefill 1,929–2,547 tok/s @8–32K; ~20 min cold at 128K (cited). Decode 8.57–8.83 tok/s C=1; 15.21 tok/s C=12 with production suffix draft.</td>
      <td>Prefill 8,029–39,430 tok/s @8–123K (20x/4.7x over old at 8K/32K). Decode 12.03–13.06 tok/s C=1 (~1.5x); 110.92 tok/s C=12 with no draft (not apples-to-apples vs. old’s suffix number — see Surprises).</td>
    </tr>
    <tr>
      <td><strong>KV budget</strong></td>
      <td>453,184 tokens measured @ 262,144 max-len (1.73x concurrency). Single-request ceiling 256K.</td>
      <td>270,592 tokens measured @ 131,072 max-len (2.06x concurrency) — ~40% less aggregate. Single-request ceiling 131K as deployed <em>that day; raised to 262K, the model’s native max, the next day — see Update.</em></td>
    </tr>
    <tr>
      <td><strong>Speculative decoding</strong></td>
      <td>suffix, production-tuned, integrated.</td>
      <td>None as of this spike. <em>ngram shipped the next day — see Update.</em></td>
    </tr>
    <tr>
      <td><strong>Stack maintenance</strong></td>
      <td>Custom fork of 0.19.0-tr5: hand-maintained <code class="language-plaintext highlighter-rouge">gptq.py</code> patch plus TurboQuant’s six historical integration fixes (monkey-patches, core-file mount overlays, worker-subprocess re-import hooks). Frozen at 0.19 indefinitely — no upgrade path without redoing the TQ integration.</td>
      <td>Tracks <code class="language-plaintext highlighter-rouge">intel/vllm:latest</code>’s rolling dev branch directly. One bind-mounted file (<code class="language-plaintext highlighter-rouge">marlin_utils.py</code>) as the only carve-out. Re-pulling the image is the upgrade path, not a re-port.</td>
    </tr>
    <tr>
      <td><strong>Stability (this session)</strong></td>
      <td>No wedge, no Level-Zero/UR errors across two boots.</td>
      <td>No wedge, no BMG crash signature (no SIGABRT #27408, no GP-fault #41663). Boots in ~3m51s cold; tool-calling (<code class="language-plaintext highlighter-rouge">hermes</code> parser) verified clean post-migration.</td>
    </tr>
  </tbody>
</table>

<p>Given this, I migrated production the same day I finished collecting the numbers. Three things tipped it:</p>

<ol>
  <li><strong>The prefill win changes what’s usable interactively, not just what’s fast on a benchmark.</strong> A cold 8K-token prompt going from ~14.5s to ~0.7s is the difference between “wait” and “instant” for the RAG and coding-assistant sessions that are most of what this box actually serves.</li>
  <li><strong>The stack-maintenance column isn’t close.</strong> Six historical TurboQuant integration fixes plus a hand-maintained GPTQ patch is an ongoing cost against every future vLLM upgrade. One bind-mounted <code class="language-plaintext highlighter-rouge">marlin_utils.py</code> against a rolling upstream branch is a cost I can plausibly stay ahead of.</li>
  <li><strong>Nothing broke that matters for the actual production workload.</strong> Tool-calling (the <code class="language-plaintext highlighter-rouge">hermes</code> parser, function-calling for the coding-assistant setup) came back clean after cutover — verified against a live <code class="language-plaintext highlighter-rouge">get_weather</code>-style request, not assumed. Both the old served-model-name (<code class="language-plaintext highlighter-rouge">qwen3-30b-tq-256k</code>) and a new one (<code class="language-plaintext highlighter-rouge">qwen3-30b-a3b-w4a16</code>) are served, so existing client configs didn’t need to change.</li>
</ol>

<p>What I gave up: TurboQuant’s KV headroom (~40% less aggregate cache, single-request ceiling 256K → 131K) and suffix speculative decoding, which has no equivalent on the new stack yet. If a workload leans on suffix decoding’s edge on repetitive content — the April 16 post’s 32.44 tok/s at 32K on padded system prompts — this migration is a step back for that specific case until spec decode lands upstream. For this box’s actual traffic — interactive chat and coding-assistant sessions, not long repetitive-context batch workloads — the prefill win dominates and the decode/KV costs are acceptable. Both of these aged fast: the ceiling went back to 262K and ngram speculative decoding shipped within 24 hours (see the Update below). Ngram isn’t suffix, though — it closes part of the spec-decode gap, not all of it, and the repetitive-content case above is still unmeasured on the new stack.</p>

<p>Rollback isn’t theoretical, but it’s worth separating two different commands here. <code class="language-plaintext highlighter-rouge">node_dark.sh restore</code> brings production back after a bench-cycle drain (not a version rollback) — that’s what actually ran, repeatedly, restoring production between benchmark runs this session. The rollback to the TurboQuant stack is a different procedure: restore <code class="language-plaintext highlighter-rouge">docker-compose.yml.tq-rollback</code> + <code class="language-plaintext highlighter-rouge">.env.tq-rollback</code>, then <code class="language-plaintext highlighter-rouge">switch-model.sh qwen3-30b-tq-256k</code>, then <code class="language-plaintext highlighter-rouge">docker compose --profile gpu up -d --force-recreate vllm</code> — shown in full in the Repro section, and proven working this same session (450s to healthy). It just wasn’t needed for this call.</p>

<h2 id="honest-limits">Honest limits</h2>

<ul>
  <li><strong>The image is vLLM <code class="language-plaintext highlighter-rouge">0.21.1.dev17+g0a4756bb5</code>, not 0.23.</strong> <code class="language-plaintext highlighter-rouge">intel/vllm:latest</code> tracks a rolling dev branch. This entire spike started under a “0.23” working title before the first boot corrected it — noting it here in case that number is floating around anywhere else in this project’s history.</li>
  <li><strong>XMX/DPAS dispatch is not ISA-verified.</strong> The strings <code class="language-plaintext highlighter-rouge">"xmx"</code> and <code class="language-plaintext highlighter-rouge">"dpas"</code> don’t appear anywhere in this image’s Python source. Confirmed: the upstream XPU <code class="language-plaintext highlighter-rouge">FLASH_ATTN</code> backend dispatches — not an eager/SDPA/CPU fallback — unforced by fp8 KV, and <code class="language-plaintext highlighter-rouge">platforms/xpu.py</code> calls the kernel “FMHA sycl-tla kernels.” Not confirmed: ISA-level proof that the compiled <code class="language-plaintext highlighter-rouge">vllm_xpu_kernels</code> binary is issuing <code class="language-plaintext highlighter-rouge">dpas</code> instructions. Calling it XMX/DPAS by the kernel library’s design, not by verification.</li>
  <li><strong>Both stacks run on a patch.</strong> The old stack needs <code class="language-plaintext highlighter-rouge">gptq.py</code> to boot on XPU at all. The new stack needed a bind-mounted <code class="language-plaintext highlighter-rouge">marlin_utils.py</code> carve-out because <code class="language-plaintext highlighter-rouge">check_moe_marlin_supports_layer()</code> excludes ROCm but not XPU, routing W4A16 MoE to a CUDA-only Marlin kernel that isn’t compiled for XPU. Neither is pure-stock.</li>
  <li><strong>fp8’s aggregate KV budget is ~40% smaller than TurboQuant’s</strong>, and this deploy’s single-request ceiling dropped from 256K (262,144) to 131K (131,072) <em>that day</em>. That 131,072 cap was this spike’s deliberate conservative setting, carried into production — not a proven hard limit, and it didn’t stay a limit for long: pushed to the model’s full native 262,144 the very next day, KV pool unchanged (see the Update below). The aggregate budget itself (270,592 tokens) is unchanged either way — that’s the part of this tradeoff that’s actually load-bearing, not the per-request ceiling.</li>
  <li><strong>No speculative decoding on the new stack, as of this writing.</strong> Every new-stack number above is draft-none. The C=12 aggregate comparison (110.92 vs. 15.21 tok/s) pits a no-draft config against old-stack production suffix decoding and is explicitly not apples-to-apples. Resolved the next day — ngram speculative decoding shipped to production; see the Update below.</li>
  <li><strong>Stack-vs-stack, not an isolated attention-kernel benchmark.</strong> Attention backend, weight quant, and KV scheme all changed together; the measured deltas can’t be cleanly attributed to FlashAttention alone.</li>
  <li><strong>C=1 is the primary story; exactly one C=12 aggregate cell per stack.</strong> No broader concurrency sweep.</li>
  <li><strong>5-prompt samples, not 16.</strong> Same noise caveat as the April 16 post — expect roughly ±10-15% at this sample size.</li>
  <li><strong>Old stack’s 131,072-context prefill and decode rows are CITED, not re-run this session</strong> — the known ~20-minute O(N²) cold-eager-prefill wedge risk. The new stack’s largest measured context is 122,880, not literally 131,072 — close, not identical.</li>
  <li><strong>Idle-node protocol, stated plainly:</strong> drained production via <code class="language-plaintext highlighter-rouge">docker compose stop vllm open-webui</code> (health-drain — the cluster router’s health check fails and reroutes), never <code class="language-plaintext highlighter-rouge">iptables -j REJECT</code> (a prior session found that triggers a reconnect storm that loads the host CPU and skews prefill timing). Verified idle before benching: connections on host <code class="language-plaintext highlighter-rouge">:8000</code> dropped to only loopback <code class="language-plaintext highlighter-rouge">TIME-WAIT</code> entries, the legacy <code class="language-plaintext highlighter-rouge">192.168.0.62</code> feeder showed zero established connections, and host load average was quiescent. Old and new stacks were benched sequentially on dark port 8001, never concurrently, and production was restored on 8000 — then migrated — as an explicit exit step, not left drained.</li>
  <li><strong>XPU-specific.</strong> Ratios here won’t transfer to other hardware. Battlemage-specific fragility this project has documented before (SIGABRT on B-series model inspection, TP=2 GP-fault) wasn’t triggered by this workload — that isn’t the same as saying it’s fixed.</li>
</ul>

<h2 id="repro">Repro</h2>

<p><strong>Drain / verify / restore</strong> (<code class="language-plaintext highlighter-rouge">scripts/node_dark.sh</code>):</p>

<div class="language-plaintext highlighter-rouge"><div class="highlight"><pre class="highlight"><code>cd /apps/b70-vllm/turboquant-xpu/.worktrees/vllm-023-spike
scripts/node_dark.sh drain     # docker compose stop vllm open-webui on :8000
scripts/node_dark.sh verify    # confirms ~0 conns on :8000, legacy feeder quiet, load avg low
# ... bring the stack-under-test up on dark port 8001, bench, tear down ...
scripts/node_dark.sh restore   # brings current prod stack back up (compose up), polls /health up to 12 min — not a version rollback
</code></pre></div></div>

<p><strong>Old stack on 8001:</strong></p>

<div class="language-plaintext highlighter-rouge"><div class="highlight"><pre class="highlight"><code>cd /apps/b70-vllm
./switch-model.sh qwen3-30b-tq-256k
VLLM_PORT=8001 VLLM_SPEC_CONFIG='' docker compose --profile gpu up -d --force-recreate vllm
</code></pre></div></div>

<p><strong>New stack on 8001</strong> (<code class="language-plaintext highlighter-rouge">deploy/docker-compose.vllm023.yml</code> + <code class="language-plaintext highlighter-rouge">deploy/.env</code> + <code class="language-plaintext highlighter-rouge">deploy/vllm023.env</code>):</p>

<div class="language-plaintext highlighter-rouge"><div class="highlight"><pre class="highlight"><code>cd /apps/b70-vllm/turboquant-xpu/.worktrees/vllm-023-spike/deploy
docker compose -f docker-compose.vllm023.yml up -d
</code></pre></div></div>

<p><strong>Bench harness</strong> (<code class="language-plaintext highlighter-rouge">scripts/bench_vllm023.py</code> — new; splits prefill and decode instead of conflating them like <code class="language-plaintext highlighter-rouge">bench_c1_context.py</code>):</p>

<div class="language-plaintext highlighter-rouge"><div class="highlight"><pre class="highlight"><code>.venv-sycl/bin/python scripts/bench_vllm023.py --stack old --metric prefill \
  --endpoint http://localhost:8001 --model-alias qwen3-30b-tq-256k \
  --ctx 8192 --n-prompts 5 --output docs/tuning/c1_vllm023_old_2026-07-04.txt

.venv-sycl/bin/python scripts/bench_vllm023.py --stack new --metric aggregate \
  --endpoint http://localhost:8001 --model-alias qwen3-30b-w4a16 \
  --ctx 8192 --concurrency 12 --max-tokens 200 --note nodraft,C12 \
  --output docs/tuning/c1_vllm023_new_2026-07-04.txt
</code></pre></div></div>

<p>Chart: <code class="language-plaintext highlighter-rouge">scripts/plot_vllm023_compare.py --inputs docs/tuning/c1_vllm023_old_2026-07-04.txt docs/tuning/c1_vllm023_new_2026-07-04.txt --out site/assets/vllm023_compare_2026-07-04.png</code>.</p>

<p>Raw data (committed): <a href="https://github.com/bryanvine/turboquant-xpu/blob/main/docs/tuning/c1_vllm023_old_2026-07-04.txt"><code class="language-plaintext highlighter-rouge">c1_vllm023_old_2026-07-04.txt</code></a> / <a href="https://github.com/bryanvine/turboquant-xpu/blob/main/docs/tuning/c1_vllm023_old_2026-07-04.txt.kvlog"><code class="language-plaintext highlighter-rouge">.kvlog</code></a>, <a href="https://github.com/bryanvine/turboquant-xpu/blob/main/docs/tuning/c1_vllm023_new_2026-07-04.txt"><code class="language-plaintext highlighter-rouge">c1_vllm023_new_2026-07-04.txt</code></a> / <a href="https://github.com/bryanvine/turboquant-xpu/blob/main/docs/tuning/c1_vllm023_new_2026-07-04.txt.kvlog"><code class="language-plaintext highlighter-rouge">.kvlog</code></a>.</p>

<p><strong>Rollback</strong>, proven working during this same session (450s to healthy):</p>

<div class="language-plaintext highlighter-rouge"><div class="highlight"><pre class="highlight"><code>cp /apps/b70-vllm/docker-compose.yml.tq-rollback /apps/b70-vllm/docker-compose.yml
cp /apps/b70-vllm/.env.tq-rollback /apps/b70-vllm/.env
cd /apps/b70-vllm &amp;&amp; ./switch-model.sh qwen3-30b-tq-256k
docker compose --profile gpu up -d --force-recreate vllm
</code></pre></div></div>

<p>Full deployment source: <a href="https://github.com/bryanvine/turboquant-xpu">github.com/bryanvine/turboquant-xpu</a>. The upstream Marlin-MoE carve-out patch lives at <code class="language-plaintext highlighter-rouge">patches/vllm023_upstream_fixes/marlin_utils.py</code> in the worktree (mirrored to production at <code class="language-plaintext highlighter-rouge">/apps/b70-vllm/vllm-patches/marlin_utils.py</code>, host-specific, not in-repo).</p>

<h2 id="update-2026-07-05-pushing-to-262k-and-settling-speculative-decoding">Update (2026-07-05): pushing to 262K and settling speculative decoding</h2>

<p>Two of the items flagged above in “Honest limits” and “What’s next” didn’t survive 24 hours as open questions. The conservative 131K ceiling got tested properly, and the “no speculative decoding” gap got closed — though not cleanly on the first attempt at closing it.</p>

<h3 id="the-ceiling-was-self-imposed-not-measured">The ceiling was self-imposed, not measured</h3>

<p>131,072 was flagged above as “this spike’s deliberate conservative setting… not a proven hard limit,” with the fp8 pool already sized at more than double that. It held up under an actual test: <code class="language-plaintext highlighter-rouge">--max-model-len</code> went to 262,144 — Qwen3-30B-A3B’s native max context (~270K) — and the stack booted and served cleanly, no code changes required.</p>

<div class="language-plaintext highlighter-rouge"><div class="highlight"><pre class="highlight"><code>[cache.py:261] Using fp8 data type to store kv cache. It reduces the GPU memory footprint...
[xpu.py:96] Using Flash Attention backend.
[flash_attn.py:641] Using FlashAttention version 2
[kv_cache_utils.py:1710] GPU KV cache size: 270,592 tokens
[kv_cache_utils.py:1711] Maximum concurrency for 262,144 tokens per request: 1.03x
</code></pre></div></div>

<p>The number that matters here is the one that <em>didn’t</em> move: the KV pool is still 270,592 tokens — identical to the figure measured at the old 131,072 max-len earlier in this post. <code class="language-plaintext highlighter-rouge">--max-model-len</code> sets the per-request ceiling, not the pool size; the pool is fixed by <code class="language-plaintext highlighter-rouge">--gpu-memory-utilization</code> and the model/KV-dtype footprint, independent of it. So the “single-request ceiling 256K → 131K” framing above is now stale: <strong>the new stack’s ceiling is 262K, matching the old TurboQuant stack’s</strong>, at 1.03x concurrency for full-length requests. The real, still-standing gap between the two stacks is what it always was — the ~40%-smaller aggregate pool (270,592 vs. 453,184 tokens) — not the per-request cap.</p>

<h3 id="speculative-decoding-three-tried-one-ships">Speculative decoding: three tried, one ships</h3>

<ul>
  <li><strong>suffix</strong> — doesn’t boot. <code class="language-plaintext highlighter-rouge">SpeculativeConfig.__post_init__</code> hard-fails at config validation (<code class="language-plaintext highlighter-rouge">config/speculative.py:769</code>), before the engine starts: <code class="language-plaintext highlighter-rouge">ImportError: Arctic Inference is required for suffix decoding. Install via 'pip install arctic-inference==0.1.1'.</code> The package isn’t in <code class="language-plaintext highlighter-rouge">intel/vllm:latest</code>. Not an XPU or FlashAttention incompatibility — a packaging gap.</li>
  <li><strong>EAGLE3</strong> — a dead end at both context settings tried. At 262,144 it doesn’t boot at all: loading the draft model brings total model memory to 16.06 GiB and leaves only 11.74 GiB free for KV cache (down from 12.39 GiB with no draft), and vLLM’s own pre-flight check refuses to start a config that can’t fit one full-length request — it needs 12.25 GiB and estimates a max feasible len of 251,200. Retried at 131,072, where it does boot — and decodes <em>slower</em> than no-SD (12.04 vs. 12.79 tok/s): draft acceptance runs 40% on short prompts but collapses to 0.0% at 8K context, almost certainly because the draft’s own <code class="language-plaintext highlighter-rouge">config.json</code> caps <code class="language-plaintext highlighter-rouge">max_position_embeddings</code> at 2048 and it’s being fed positions far outside that range. Output stays correct regardless (a rejected draft just falls back to the target model), but a 0%-acceptance draft is pure overhead.</li>
  <li><strong>ngram</strong> — works, and costs nothing: it’s prompt-lookup, no draft weights, no draft KV, so the pool stays at the full 270,592 tokens regardless of whether it’s enabled. Whether it’s worth shipping turned out to depend entirely on concurrency.</li>
</ul>

<h3 id="the-concurrency-curve-and-nearly-shipping-the-wrong-answer">The concurrency curve, and nearly shipping the wrong answer</h3>

<p>Aggregate tok/s with <code class="language-plaintext highlighter-rouge">--max-model-len</code> set to 262,144, actual prompt context 8,192 tokens, warm/steady-state. (The literal first request after a cold boot pays a one-time ~20s JIT/compile tax that has nothing to do with speculative decoding — measured, confirmed via a warm re-run, and controlled for symmetrically on both sides below.)</p>

<table>
  <thead>
    <tr>
      <th>concurrency</th>
      <th style="text-align: right">ngram</th>
      <th style="text-align: right">no-SD</th>
      <th style="text-align: right">ngram Δ</th>
    </tr>
  </thead>
  <tbody>
    <tr>
      <td>C=1</td>
      <td style="text-align: right">13.96</td>
      <td style="text-align: right">11.22</td>
      <td style="text-align: right">+24%</td>
    </tr>
    <tr>
      <td>C=2</td>
      <td style="text-align: right">28.14</td>
      <td style="text-align: right">24.74</td>
      <td style="text-align: right">+14%</td>
    </tr>
    <tr>
      <td>C=3</td>
      <td style="text-align: right">41.34</td>
      <td style="text-align: right">37.01</td>
      <td style="text-align: right">+12%</td>
    </tr>
    <tr>
      <td>C=4</td>
      <td style="text-align: right">51.18</td>
      <td style="text-align: right">50.34</td>
      <td style="text-align: right">+2%</td>
    </tr>
    <tr>
      <td>C=12</td>
      <td style="text-align: right">39.99</td>
      <td style="text-align: right">72.56</td>
      <td style="text-align: right">−45%</td>
    </tr>
  </tbody>
</table>

<p>ngram forces two things at dispatch time, unconditionally: <code class="language-plaintext highlighter-rouge">Async scheduling not supported with ngram-based speculative decoding and will be disabled</code>, and <code class="language-plaintext highlighter-rouge">max_num_scheduled_tokens is set to 2048</code>. Neither costs anything at C≤4 — a decode step at that concurrency needs on the order of tens of scheduled token-slots, nowhere near the cap. But it’s the same mechanism either way, and once concurrency is high enough for async-scheduling-off and the 2048 cap to actually bind, the win inverts hard: by C=12 the scheduling tax outweighs ngram’s per-token benefit by a wide margin. The shape is clean and monotonic — +24% → +14% → +12% → +2% → −45% — exactly what you’d expect from a roughly fixed per-token speculative win competing against a scheduling cost that scales with concurrency.</p>

<p>That shape is also why this nearly shipped the wrong config. The first pass at this decision measured exactly two points — C=1 and C=12 — saw the C=12 number, and came within a hair of shipping <strong>no speculative decoding at all</strong>, on the strength of a single high-concurrency cell. The gap: this node’s actual traffic is C=1 through C=4, usually C=1, and effectively never C=12. That’s precisely the regime where ngram wins at every measured point — and wins biggest exactly where most of the traffic lives (C=1, +24%). The lesson isn’t “ngram is good” or “ngram is bad.” It’s <strong>measure at your actual concurrency, not a convenient round number.</strong> C=1 and C=12 were convenient to bench; they aren’t what this box serves.</p>

<h3 id="final-config">Final config</h3>

<p>Production now runs <strong>262K context + ngram speculative decoding</strong> — <code class="language-plaintext highlighter-rouge">--speculative-config '{"method":"ngram","num_speculative_tokens":5,"prompt_lookup_max":4,"prompt_lookup_min":2}'</code> — on top of the same W4A16 + fp8 KV + FlashAttention stack described above. Post-change verification: tool-calling still comes back clean (a <code class="language-plaintext highlighter-rouge">get_weather</code>-style call returns a well-formed <code class="language-plaintext highlighter-rouge">finish_reason:"tool_calls"</code>), and the KV pool is unchanged at 270,592 tokens, 1.03x concurrency at the full 262,144 ceiling — ngram genuinely costs zero pool capacity, confirmed rather than assumed. Everything else in the production command is byte-identical to the config described earlier in this post; ngram’s config block is the only addition. A rollback snapshot (<code class="language-plaintext highlighter-rouge">docker-compose.yml.pre-ngram</code>) exists on the same pattern as the TQ rollback in Repro, and wasn’t needed.</p>

<h2 id="follow-up-2026-07-05-the-newer-hybrid-models--qwen35--36">Follow-up (2026-07-05): the newer hybrid models — Qwen3.5 &amp; 3.6</h2>

<p>The whole premise of this migration was riding whatever frontier move a B70 can actually ride. So the obvious next question: now that we’re on upstream, can the upgraded stack run the <em>newer</em> open models — Qwen3.5-35B-A3B and Qwen3.6-35B-A3B? Both are hybrid <strong>Gated-DeltaNet + sparse-MoE</strong> architectures (linear-attention layers interleaved 3:1 with full attention), and getting Qwen3.5 to run at all was a 17-task custom-image project back in April. Short version: <strong>one of them works, neither is worth swapping to, and the reason is instructive.</strong></p>

<h3 id="the-good-news-native-gdn-on-xpu-is-real-now">The good news: native GDN on XPU is real now</h3>

<p>In April, the Gated-DeltaNet layers had no XPU dispatcher — they fell back to a Triton/FLA path that produced gibberish, and getting Qwen3.5 to ~7 tok/s took a hand-built <code class="language-plaintext highlighter-rouge">0.19.1rc0</code> image with an unmerged kernel PR. That work is now upstream: <code class="language-plaintext highlighter-rouge">intel/vllm:latest</code> ships <code class="language-plaintext highlighter-rouge">torch.ops.vllm.gdn_attention_core_xpu</code>, a native Battlemage GDN kernel wired into the model’s <code class="language-plaintext highlighter-rouge">forward_xpu</code>. (The boot log’s <code class="language-plaintext highlighter-rouge">Using Triton/FLA GDN prefill kernel</code> line is a red herring — the XPU platform hook reassigns the forward method to the native op right after it prints.) Confirmed working by Qwen3.5 producing coherent output — the thing April hand-built now comes in the box.</p>

<h3 id="qwen35-35b-a3b-official-gptq-int4-works-but-slow-and-fragile">Qwen3.5-35B-A3B (official GPTQ-Int4): works, but slow and fragile</h3>

<p>The official Qwen GPTQ checkpoint is a genuine multimodal build — text weights, fp16 vision tower, MTP draft layers — so it loads on the stock, fully-wired <code class="language-plaintext highlighter-rouge">Qwen3_5MoeForConditionalGeneration</code> class with <strong>zero code patches</strong>. It runs, and it’s coherent (it’s a <em>thinking</em> model — emits a visible reasoning trace before answering). But it took a specific, constrained config to get there:</p>

<ul>
  <li><strong><code class="language-plaintext highlighter-rouge">--enforce-eager</code> is mandatory.</strong> With <code class="language-plaintext highlighter-rouge">torch.compile</code> on (the production default), boot hangs — one core pegged for 20+ minutes compiling the GDN <code class="language-plaintext highlighter-rouge">splitting_ops</code>, never reaching serving. Eager mode boots, but forfeits the compile speedup that the 30B stack enjoys.</li>
  <li><strong>No prefix caching.</strong> Enabling it forces an experimental “align” mamba cache mode whose state-copy path crashes on this build (<code class="language-plaintext highlighter-rouge">get_mamba_state_copy_func()</code> returns <code class="language-plaintext highlighter-rouge">None</code> → <code class="language-plaintext highlighter-rouge">TypeError: object of type 'NoneType' has no len()</code>).</li>
  <li><strong>GPTQ is fp16-only</strong> (it rejects <code class="language-plaintext highlighter-rouge">bfloat16</code> outright) and boots with a <code class="language-plaintext highlighter-rouge">"4-bit gptq_gemm kernel is buggy, switch to gptq_marlin"</code> warning — and Marlin is CUDA-only on this card. It runs anyway; that’s just not a reassuring banner.</li>
  <li>~5.4 min cold boot, and only <strong>6.46 GiB</strong> left for KV after the 23 GB of weights + the vision tower.</li>
</ul>

<p>Throughput at the concurrency this box actually serves (C=1–4):</p>

<table>
  <thead>
    <tr>
      <th>metric</th>
      <th style="text-align: right">Qwen3.5-35B GPTQ</th>
      <th style="text-align: right">Qwen3-30B-A3B (current)</th>
    </tr>
  </thead>
  <tbody>
    <tr>
      <td>decode, C=1</td>
      <td style="text-align: right"><strong>7.3 tok/s</strong></td>
      <td style="text-align: right">~13 tok/s</td>
    </tr>
    <tr>
      <td>aggregate, C=2</td>
      <td style="text-align: right">14.6 tok/s</td>
      <td style="text-align: right">28.1 (ngram)</td>
    </tr>
    <tr>
      <td>aggregate, C=4</td>
      <td style="text-align: right">29.0 tok/s</td>
      <td style="text-align: right">51.2 (ngram)</td>
    </tr>
    <tr>
      <td>prefill @2K / @8K</td>
      <td style="text-align: right">3,429 / 5,033 tok/s</td>
      <td style="text-align: right">—</td>
    </tr>
  </tbody>
</table>

<p>3.5’s aggregate cells are measured at 2K context vs. the 30B curve’s 8K, so those two columns aren’t a clean overlay — but the single-stream C=1 decode, the cleanest comparison, is unambiguous: <strong>~7.3 vs ~13 tok/s, roughly half.</strong> That’s the <code class="language-plaintext highlighter-rouge">--enforce-eager</code> tax, mostly — the 30B gets <code class="language-plaintext highlighter-rouge">torch.compile</code>; the hybrid can’t.</p>

<h3 id="qwen36-35b-a3b-community-ct-int4-boots-generates-garbage">Qwen3.6-35B-A3B (community CT-INT4): boots, generates garbage</h3>

<p>3.6 is the newer model and the one I actually wanted. The only checkpoint on disk that could run on XPU is a community <code class="language-plaintext highlighter-rouge">compressed-tensors</code> INT4 quant, and it turned out to be a text-only-weights build wearing a multimodal config. Upstream’s <em>text-only</em> Qwen3.5/3.6 classes are only half-wired, so getting it to boot took a stack of patches: register the text-only class in the model registry, tag it <code class="language-plaintext highlighter-rouge">IsHybrid</code> (so <code class="language-plaintext highlighter-rouge">mamba_block_size</code> gets set at all), add the two <code class="language-plaintext highlighter-rouge">get_mamba_state_*_from_config</code> classmethods the hybrid-KV setup calls, and implement <code class="language-plaintext highlighter-rouge">get_mrope_input_positions</code> (Qwen3.5/3.6 use M-RoPE even for text). After all that it boots, profiles, and generates <strong>fast — 80 tok/s</strong> — but the output is word-salad (<code class="language-plaintext highlighter-rouge">"om garò prezi domesticeder ò…"</code>). fp16 vs. bf16 changed the <em>flavor</em> of garbage (<code class="language-plaintext highlighter-rouge">!!!!</code> → word-salad) but not the fact of it; keeping vs. stripping M-RoPE made no difference. Weights load with no missing-tensor warnings, so it’s either a bad community quant or a subtle fault in the text-only load path — and I couldn’t isolate which, because the only other 3.6 checkpoint available is a GGUF, which doesn’t run on XPU at all. Unresolved, and not deployable with the weights on hand.</p>

<h3 id="the-call-kept-the-30b">The call: kept the 30B</h3>

<p>Both hybrids share one disqualifying trait for this box: <strong>the <code class="language-plaintext highlighter-rouge">torch.compile</code> hang forces <code class="language-plaintext highlighter-rouge">--enforce-eager</code>, which roughly halves decode throughput</strong> versus the compiled 30B. Stack that on top of 3.5’s thinking-model verbosity (more tokens per answer, so <em>felt</em> latency is worse than the raw tok/s gap already shows), its GPTQ fragility and tiny KV budget, and 3.6 being outright broken — and there’s no version of “swap to a 35B” that comes out ahead for a C=1-dominant interactive box that cares about latency. The intelligence edge of a newer 35B-A3B is real, but it doesn’t buy back half the speed plus the operational tax.</p>

<p>Same lesson as the speculative-decoding curve above, from the other direction: <strong>the 30B wins where the traffic actually lives (C=1–4).</strong> The migration’s verdict stands — the 30B stays.</p>

<p>Two things would flip it, and I’ll re-check both on the next image bump: a <strong>bf16/W4A16 (non-GPTQ) Qwen3.5/3.6 checkpoint that loads via the stock multimodal class</strong> (no text-only patch surface, no fp16-only constraint), or <strong><code class="language-plaintext highlighter-rouge">torch.compile</code> no longer hanging on the GDN layers</strong> — which would hand the hybrids their missing ~2x and likely put a 35B-A3B ahead of the 30B outright.</p>

<h2 id="follow-up-2026-07-06-the-speculative-decoding-call-was-wrong--eagle-3-ships">Follow-up (2026-07-06): the speculative-decoding call was wrong — EAGLE-3 ships</h2>

<p>The Update above wrote EAGLE-3 off as “a dead end at this model’s context lengths” and shipped ngram — with one hedge buried in the diagnosis: acceptance “collapses to 0.0% at 8K context, almost certainly because the draft’s own <code class="language-plaintext highlighter-rouge">config.json</code> caps <code class="language-plaintext highlighter-rouge">max_position_embeddings</code> at 2048.” That hunch was right. It was also the <em>entire</em> story, and chasing it down flipped the production decision.</p>

<h3 id="0-acceptance-at-long-context-was-a-config-bug-not-a-model-limit">“~0% acceptance at long context” was a config bug, not a model limit</h3>

<p>Put EAGLE-3 back on an isolated port, swept draft acceptance against prompt length. It isn’t a slope, it’s a cliff:</p>

<table>
  <thead>
    <tr>
      <th>prompt context</th>
      <th style="text-align: right">mean accepted tokens/step</th>
    </tr>
  </thead>
  <tbody>
    <tr>
      <td>~1.2–1.6K</td>
      <td style="text-align: right">1.3–1.6 (healthy)</td>
    </tr>
    <tr>
      <td>~1.9K</td>
      <td style="text-align: right">0.44 (sliding)</td>
    </tr>
    <tr>
      <td><strong>≥2.6K</strong></td>
      <td style="text-align: right"><strong>0.00</strong> (every position, zero)</td>
    </tr>
  </tbody>
</table>

<p>Acceptance drops to <em>exactly</em> zero the moment the prompt crosses <strong>2048 tokens</strong>, and stays pinned there. A weak draft still lands the occasional common token; zero across ~1,000 proposals is a switch flipping off. The draft’s <code class="language-plaintext highlighter-rouge">config.json</code> says <code class="language-plaintext highlighter-rouge">max_position_embeddings: 2048</code>, vLLM honours it, so past position 2048 the draft’s RoPE is garbage and the target rejects 100% of it. (The head’s README even ships a <code class="language-plaintext highlighter-rouge">SGLANG_ALLOW_OVERWRITE_LONGER_CONTEXT_LEN=1</code> escape hatch — a known sharp edge, just not one vLLM lifts for you.) And it is <em>not</em> chunked prefill: raising <code class="language-plaintext highlighter-rouge">--max-num-batched-tokens</code> to 32,768 so a 25K prompt prefills in one chunk changed nothing. The cliff tracks absolute context, not batching.</p>

<h3 id="the-fix-one-field">The fix: one field</h3>

<p>Copy the head, set <code class="language-plaintext highlighter-rouge">max_position_embeddings</code> to the target’s 262K ceiling, point <code class="language-plaintext highlighter-rouge">--speculative-config</code> at the copy. No training, no long-context draft, no kernel work. Acceptance returns immediately — flat ~1.0–1.25 out to 20K, then a graceful decay at 50–74K (the genuine “this head was trained at short context” effect, but irrelevant here — see the traffic below). And it’s nearly free: the draft trims the KV pool from 270,592 to 265,664 tokens, ~1.8%. The old “EAGLE eats your pool” worry was real only for the 262K <em>boot</em> that couldn’t fit draft-weights-plus-a-full-length-request; sized normally, the 366 MB head barely registers.</p>

<h3 id="what-actually-favors-ngram-vs-eagle-3-i-had-this-backwards">What actually favors ngram vs EAGLE-3 (I had this backwards)</h3>

<p>Before replaying real traffic I predicted ngram would win, because the traffic <em>looked</em> repetitive — the same few automated system prompts all day. Wrong axis. The rule isn’t “repetitive input → ngram.” It’s:</p>

<blockquote>
  <p><strong>Does the output echo the input?</strong></p>
</blockquote>

<p>ngram is prompt-lookup — it can only propose tokens it finds <em>in the context</em>. On <strong>code continuation</strong>, where the output copies identifiers and boilerplate already on screen, it drafts 3–5 tokens at a time for free and beats EAGLE handily. On <strong>novel generation</strong> — a fresh answer, a sentiment verdict, a JSON object that isn’t sitting in the prompt — it has nothing to copy and stalls near one token, while EAGLE-3 (predicting from the model’s own hidden states) keeps drafting. Starkest single case in a content sweep: “write an original fable” → EAGLE <strong>0.76</strong> vs ngram <strong>0.062</strong>. The shape of the <em>input</em> isn’t the question; whether the <em>output</em> is in there to be copied is.</p>

<h3 id="measuring-it-a-day-of-real-traffic">Measuring it: a day of real traffic</h3>

<p>Rather than argue from synthetic prompts, I put a fail-open capture proxy in front of the server — tees every <code class="language-plaintext highlighter-rouge">/v1</code> request body to disk, forwards to vLLM, and if anything in the capture path throws it forwards anyway (never break prod for a measurement). A full business day: <strong>~1,900 real requests</strong>, and the shape was its own surprise — ~99% automated <strong>structured-JSON classification</strong> (financial-news sentiment, sports-betting research; all <code class="language-plaintext highlighter-rouge">response_format: json_object</code> or <code class="language-plaintext highlighter-rouge">guided_json</code>), every one under 2K context, and exactly <strong>two</strong> human chat messages all day. Then I replayed a sample through both configs <em>verbatim</em> — same messages, same <code class="language-plaintext highlighter-rouge">json_object</code>/<code class="language-plaintext highlighter-rouge">guided_json</code>, same temperatures — so it’s real work, not normalized toy prompts. Faithfulness check: ngram’s replayed acceptance (1.00) matches ngram measured live on the full day (1.045).</p>

<h3 id="the-result-and-the-switch">The result, and the switch</h3>

<table>
  <thead>
    <tr>
      <th> </th>
      <th style="text-align: right">mean accept</th>
      <th style="text-align: right">C=1 tok/s</th>
      <th style="text-align: right">C=4 tok/s</th>
    </tr>
  </thead>
  <tbody>
    <tr>
      <td><strong>EAGLE-3 (patched)</strong></td>
      <td style="text-align: right"><strong>1.81</strong></td>
      <td style="text-align: right"><strong>20.9</strong></td>
      <td style="text-align: right"><strong>67.2</strong></td>
    </tr>
    <tr>
      <td>ngram</td>
      <td style="text-align: right">1.00</td>
      <td style="text-align: right">12.9</td>
      <td style="text-align: right">46.9</td>
    </tr>
  </tbody>
</table>

<p>EAGLE-3 wins <strong>1.6x at C=1 and 1.4x at C=4</strong> — the margin narrows under load (both batch better as concurrency climbs) but never flips, and acceptance holds flat at ~1.8 across the range. The “repetitive input → ngram” instinct was exactly backwards here: the inputs repeat, but the outputs — the JSON verdicts — are novel every time, which is EAGLE’s court. Production now runs EAGLE-3: the patched draft on a stable path, <code class="language-plaintext highlighter-rouge">--enforce-eager</code> (same <code class="language-plaintext highlighter-rouge">torch.compile</code> caveat as the hybrids, but here it costs far less than the ~2x it buys), everything else byte-identical to the ngram config it replaced. Rollback to ngram is one <code class="language-plaintext highlighter-rouge">docker compose up</code> against the saved snapshot.</p>

<h3 id="two-things-i-got-wrong">Two things I got wrong</h3>

<p>Both were decisions, not just facts, so worth stating plainly:</p>

<ol>
  <li><strong>I wrote EAGLE-3 off</strong> as “a dead end at this model’s context lengths.” It wasn’t the model or the context — it was a four-digit number in a JSON file. The 0%-acceptance symptom was load-bearing and I’d stopped one diagnostic step short of the cause.</li>
  <li><strong>I predicted ngram would win the real traffic</strong>, and it lost — because I reasoned from the shape of the input instead of the output. The replay is the only reason the right config shipped; the prediction would have kept the wrong one.</li>
</ol>

<p>The ngram concurrency curve’s lesson was “measure at your real concurrency.” This one’s is adjacent: <strong>measure on your real traffic.</strong> The synthetic sweep got the <em>mechanism</em> right (novel output favors EAGLE); only the captured day got the <em>weighting</em> right — this box’s traffic is almost entirely novel output.</p>

<h2 id="whats-next">What’s next</h2>

<ol>
  <li><strong>Speculative decoding on the new stack — resolved, then re-resolved.</strong> ngram shipped first (see the 07-05 Update), but the 2026-07-06 follow-up above reversed it: the “EAGLE3 dead end” was the draft’s <code class="language-plaintext highlighter-rouge">max_position_embeddings: 2048</code> cap, a one-field fix, and on a captured day of real traffic <strong>EAGLE-3 beat ngram 1.4–1.6x and now ships in production.</strong> Still open: suffix decoding, which needs a derived image with <code class="language-plaintext highlighter-rouge">arctic-inference</code> baked in (this image doesn’t carry it) — untested against EAGLE-3, and only likely to matter if the traffic mix ever shifts toward output-copies-input (code editing, RAG-quoting), where prompt-lookup regains its edge.</li>
  <li><strong>Whether to reclaim context if the 270,592-token aggregate budget turns out to bite.</strong> The single-request ceiling is now the model’s own native max (262K — see the Update above), so there’s no higher per-request context left to chase on this model; the only remaining lever is aggregate concurrency headroom (1.03x at full-length requests, as deployed). XQuant — the KV-compression idea parked from the never-built April 26 “nextgen stack” series — is the fallback if a real workload needs more concurrent full-length requests than that. fp8 already halves KV cost against fp16; XQuant would be stacking a second compression layer on top of it, the way TurboQuant did for the old stack.</li>
  <li><strong>Push <code class="language-plaintext highlighter-rouge">--max-model-len</code> closer to the measured fp8 ceiling — done.</strong> It goes all the way to 262,144, the model’s native max, with the KV pool unchanged (see the Update above). No further headroom to chase on this specific model; a higher single-request ceiling would need a different model or a context-extension trick, not just a flag change.</li>
  <li><strong>Re-check Qwen3.5 / 3.6 on the next image bump.</strong> The native GDN kernel works now (see the follow-up above); the blockers are the <code class="language-plaintext highlighter-rouge">torch.compile</code> hang that forces <code class="language-plaintext highlighter-rouge">--enforce-eager</code> (~halving throughput) and, for 3.6, a checkpoint that generates garbage. A bf16/W4A16 non-GPTQ checkpoint that loads via the stock multimodal class, or a compile path that doesn’t hang on GDN, would make a 35B-A3B genuinely competitive with — probably faster than — the 30B.</li>
</ol>

<hr />

<p><em>Fourth post in the Arc B70 series. Repo: <a href="https://github.com/bryanvine/turboquant-xpu">github.com/bryanvine/turboquant-xpu</a>. Prior posts: <a href="/turboquant-xpu/2026/04/14/spec-decode-intel-arc/">April 14</a>, <a href="/turboquant-xpu/2026/04/15/sycl-three-attempts-arc-b70/">April 15</a>, <a href="/turboquant-xpu/2026/04/16/qwen3-30b-tq-suffix-c1/">April 16</a>.</em></p>]]></content><author><name>Bryan Vine</name></author><category term="intel-arc" /><category term="llm-inference" /><category term="kv-cache" /><category term="vllm" /><category term="flash-attention" /><category term="fp8" /><category term="w4a16" /><category term="turboquant" /><category term="qwen3" /><category term="bmg-g31" /><category term="intel-arc-pro-b70" /><summary type="html"><![CDATA[TL;DR]]></summary><media:thumbnail xmlns:media="http://search.yahoo.com/mrss/" url="https://bryanvine.github.io/turboquant-xpu/og-turboquant.png" /><media:content medium="image" url="https://bryanvine.github.io/turboquant-xpu/og-turboquant.png" xmlns:media="http://search.yahoo.com/mrss/" /></entry><entry><title type="html">TurboQuant + EAGLE3 on Arc Pro B70: six integration fixes and a fused-kernel correctness regression</title><link href="https://bryanvine.github.io/turboquant-xpu/2026/04/16/qwen3-30b-tq-suffix-c1/" rel="alternate" type="text/html" title="TurboQuant + EAGLE3 on Arc Pro B70: six integration fixes and a fused-kernel correctness regression" /><published>2026-04-16T01:00:00+00:00</published><updated>2026-04-16T01:00:00+00:00</updated><id>https://bryanvine.github.io/turboquant-xpu/2026/04/16/qwen3-30b-tq-suffix-c1</id><content type="html" xml:base="https://bryanvine.github.io/turboquant-xpu/2026/04/16/qwen3-30b-tq-suffix-c1/"><![CDATA[<h2 id="tldr">TL;DR</h2>

<ul>
  <li>Deployed <strong>Qwen3-30B-A3B + TurboQuant k3v4_nc + speculative decoding</strong> on the Arc Pro B70 (32 GiB Xe2 Battlemage, vllm-xpu 0.19). Six integration fixes were needed before the stack would serve a single token, and one more fused-kernel finding turned up during end-to-end validation.</li>
  <li><strong>EAGLE3 + TurboQuant works.</strong> The prior <a href="https://github.com/bryanvine/turboquant-xpu/blob/main/docs/BENCHMARK_QWEN3_30B.md">BENCHMARK_QWEN3_30B.md</a> had flagged this combination as “unintegrated — would require the draft model’s attention backend to also support TQ cache reads.” The real answer: the draft reuses a separate FP16 cache path; nothing special needs to happen on the TQ side for EAGLE3 target-model verification to succeed.</li>
  <li><strong>The fused-N_spec Triton kernel has a correctness regression on XPU.</strong> It compiles, the micro-bench’s numerical check passes, but in real deployment it produces garbage tokens. Details below. Kernel is gated off in the production config (<code class="language-plaintext highlighter-rouge">TQ_USE_FUSED_SPEC=0</code>) pending a follow-up fix.</li>
  <li><strong>C=1 throughput matrix across {suffix, EAGLE3} × {TQ k3v4_nc, FP16}</strong> at 8K and 32K contexts below. TL;DR for picking a config: FP16 wins throughput, TQ wins memory ceiling, suffix wins when the prompt is repetitive, EAGLE3 wins when acceptance has to hold up on prose — pick your tradeoff.</li>
  <li>Third post in this <a href="https://bryanvine.github.io/turboquant-xpu/">Arc B70 series</a>. Previous posts: <a href="/turboquant-xpu/2026/04/14/spec-decode-intel-arc/">the first SYCL PoC + 2× Triton fix</a>, <a href="/turboquant-xpu/2026/04/15/sycl-three-attempts-arc-b70/">three SYCL attempts and the gap to Triton</a>.</li>
</ul>

<h2 id="why-c1-matters-on-b70">Why C=1 matters on B70</h2>

<p>The B70 saturates around C=12–20 regardless of preset, so production scale-out isn’t the interesting question on this silicon. What <em>is</em> interesting is how much context a single user can work with — RAG windows, long documents, multi-turn coding sessions. Gemma4-31B + suffix at FP16 holds 88K ctx. TurboQuant promises ~8.5× KV capacity on Qwen3-30B-A3B thanks to uniform <code class="language-plaintext highlighter-rouge">head_dim=128</code> + strong GQA + MoE sparsity. If that compounds with speculative decoding, we should be able to serve 128K–256K single-user contexts with headroom.</p>

<p>This post is about the gap between that promise and what actually shipped.</p>

<h2 id="the-six-integration-fixes">The six integration fixes</h2>

<p>vllm-xpu 0.19 predates the upstream TurboQuant PR (#38479). The <code class="language-plaintext highlighter-rouge">turboquant-xpu/patches/</code> directory contains the vLLM core-file overlays and the <code class="language-plaintext highlighter-rouge">turboquant_register.py</code> monkey-patch module that bridges the two. Six distinct problems had to be solved before the stack would even parse its own arguments.</p>

<h3 id="1-find_module--find_spec-python-312-deprecation">1. <code class="language-plaintext highlighter-rouge">find_module</code> → <code class="language-plaintext highlighter-rouge">find_spec</code> (Python 3.12 deprecation)</h3>

<p><code class="language-plaintext highlighter-rouge">sitecustomize.py</code> installs a meta_path import hook that patches <code class="language-plaintext highlighter-rouge">vllm.config.cache.CacheDType</code> before vLLM reads it. The hook used the legacy <code class="language-plaintext highlighter-rouge">find_module</code>/<code class="language-plaintext highlighter-rouge">load_module</code> API. Python 3.12 no longer calls that interface during normal imports — it uses <code class="language-plaintext highlighter-rouge">find_spec</code>/<code class="language-plaintext highlighter-rouge">exec_module</code>. So our hook sat on <code class="language-plaintext highlighter-rouge">sys.meta_path</code> but never fired. Argparse kept seeing the pre-patch <code class="language-plaintext highlighter-rouge">CacheDType</code> Literal and rejected <code class="language-plaintext highlighter-rouge">turboquant_k3v4_nc</code> as an invalid <code class="language-plaintext highlighter-rouge">--kv-cache-dtype</code> value. Rewrote the hook to implement <code class="language-plaintext highlighter-rouge">find_spec</code>; argparse then recognized the preset.</p>

<h3 id="2-patching-dataclassesfieldtype-not-just-the-annotation">2. Patching <code class="language-plaintext highlighter-rouge">dataclasses.Field.type</code> (not just the annotation)</h3>

<p>After fix 1, <code class="language-plaintext highlighter-rouge">typing.get_args(vllm.config.cache.CacheDType)</code> correctly returned the TQ-extended Literal, but <code class="language-plaintext highlighter-rouge">--kv-cache-dtype turboquant_k3v4_nc</code> still failed. <code class="language-plaintext highlighter-rouge">vllm.engine.arg_utils._compute_kwargs</code> reads argparse choices from <code class="language-plaintext highlighter-rouge">dataclasses.fields(CacheConfig)[i].type</code>, which is the <strong>original</strong> Literal captured at class-definition time — patching <code class="language-plaintext highlighter-rouge">CacheConfig.__annotations__["cache_dtype"]</code> has no effect on Field objects. Had to walk <code class="language-plaintext highlighter-rouge">dataclasses.fields(CacheConfig)</code> and mutate <code class="language-plaintext highlighter-rouge">f.type</code> directly.</p>

<h3 id="3-workers-dont-inherit-monkey-patches">3. Workers don’t inherit monkey-patches</h3>

<p><code class="language-plaintext highlighter-rouge">VLLM_WORKER_MULTIPROC_METHOD=spawn</code> means the engine-core subprocess starts with a fresh Python interpreter. Our <code class="language-plaintext highlighter-rouge">sitecustomize.py</code> auto-loads via <code class="language-plaintext highlighter-rouge">PYTHONPATH</code>, but <code class="language-plaintext highlighter-rouge">turboquant_register.apply_all_patches()</code> doesn’t run in workers unless someone explicitly imports it. The engine core OOM’d on <code class="language-plaintext highlighter-rouge">STR_DTYPE_TO_TORCH_DTYPE["turboquant_k3v4_nc"]</code> (a <code class="language-plaintext highlighter-rouge">KeyError</code> the main-process patches had fixed but the worker hadn’t). Added a retrying meta_path hook that imports <code class="language-plaintext highlighter-rouge">turboquant_register</code> as soon as <code class="language-plaintext highlighter-rouge">vllm.config.cache</code> is in <code class="language-plaintext highlighter-rouge">sys.modules</code> — works for both the main process and every subprocess worker.</p>

<h3 id="4-import-vllm-resolved-from-workspacevllm-instead-of-site-packages">4. <code class="language-plaintext highlighter-rouge">import vllm</code> resolved from <code class="language-plaintext highlighter-rouge">/workspace/vllm</code> instead of site-packages</h3>

<p>The base image’s <code class="language-plaintext highlighter-rouge">WORKDIR</code> is <code class="language-plaintext highlighter-rouge">/workspace/vllm</code>, which contains a <code class="language-plaintext highlighter-rouge">vllm/</code> subdirectory. <code class="language-plaintext highlighter-rouge">sys.path[0]=''</code> means “cwd”, so <code class="language-plaintext highlighter-rouge">import vllm</code> found <code class="language-plaintext highlighter-rouge">/workspace/vllm/vllm/</code> before <code class="language-plaintext highlighter-rouge">/opt/venv/lib/python3.12/site-packages/vllm/</code>. Our bind-mounts went to the site-packages copy, so the running vLLM ignored them entirely. The backend file was there; Python just never imported it. The entrypoint shim now <code class="language-plaintext highlighter-rouge">cd /tmp</code> before <code class="language-plaintext highlighter-rouge">exec python</code>, which pushes cwd off the vLLM package path.</p>

<h3 id="5-turboquant-enum-missing-from-the-backend-registry">5. TURBOQUANT enum missing from the backend registry</h3>

<p><code class="language-plaintext highlighter-rouge">vllm.v1.attention.backends.registry._Backend</code> is a string enum. Without <code class="language-plaintext highlighter-rouge">TURBOQUANT</code> as a member, <code class="language-plaintext highlighter-rouge">_Backend("TURBOQUANT")</code> raises <code class="language-plaintext highlighter-rouge">Unknown attention backend</code>. <code class="language-plaintext highlighter-rouge">turboquant_register.py</code> patches <code class="language-plaintext highlighter-rouge">XPUPlatform.get_attn_backend_cls</code> to return the backend path, but the enum lookup happens earlier. Mounted <code class="language-plaintext highlighter-rouge">patches/vllm_mounts/registry.py</code> statically on top of vLLM’s own registry.py. Did the same for five other core files (torch_utils, xpu, attention, attention_config, cache) as belt-and-suspenders so the working state doesn’t depend on whether monkey-patches fired in a given subprocess.</p>

<h3 id="6---max-num-seqs-4-pre-allocates-4-the-per-request-kv-budget">6. <code class="language-plaintext highlighter-rouge">--max-num-seqs 4</code> pre-allocates 4× the per-request KV budget</h3>

<p>Gemma4 production runs with <code class="language-plaintext highlighter-rouge">--max-num-seqs 4</code> at <code class="language-plaintext highlighter-rouge">--max-model-len 90112</code>, which reserves KV for 4 concurrent 90K-ctx requests. Qwen3-30B-A3B + TQ at <code class="language-plaintext highlighter-rouge">--max-model-len 262144</code> with the same <code class="language-plaintext highlighter-rouge">--max-num-seqs 4</code> reserves ~1M tokens of KV cache. Prefill activations at even 8K tokens then can’t fit in what’s left, and the engine OOMs on the first prompt. Dropping <code class="language-plaintext highlighter-rouge">--max-num-seqs 1</code> (we’re benching C=1 anyway) freed enough memory for prefill. Production deployment at max concurrency would need per-request context caps significantly below 262K.</p>

<h2 id="benchmark-matrix">Benchmark matrix</h2>

<p>2×2 matrix at C=1 with 5-prompt amortization and prefix caching enabled. Prompts are the 16-prompt mixed set from <a href="https://github.com/bryanvine/turboquant-xpu/blob/main/docs/BENCHMARK_QWEN3_30B.md">BENCHMARK_QWEN3_30B.md</a> (code / math / translation / prose / QA), truncated to 5 for this run. Harness: <a href="https://github.com/bryanvine/turboquant-xpu/blob/main/scripts/bench_c1_context.py"><code class="language-plaintext highlighter-rouge">scripts/bench_c1_context.py</code></a>. Raw results: <a href="https://github.com/bryanvine/turboquant-xpu/blob/main/docs/tuning/c1_context_sweep_2026-04-15.txt"><code class="language-plaintext highlighter-rouge">docs/tuning/c1_context_sweep_2026-04-15.txt</code></a>.</p>

<table>
  <thead>
    <tr>
      <th>config</th>
      <th style="text-align: right">8K tok/s</th>
      <th style="text-align: right">32K tok/s</th>
    </tr>
  </thead>
  <tbody>
    <tr>
      <td><strong>suffix + FP16</strong></td>
      <td style="text-align: right"><strong>12.48</strong></td>
      <td style="text-align: right"><strong>32.44</strong></td>
    </tr>
    <tr>
      <td><strong>EAGLE3 + FP16</strong></td>
      <td style="text-align: right">8.44</td>
      <td style="text-align: right">9.59</td>
    </tr>
    <tr>
      <td><strong>suffix + TQ k3v4_nc</strong></td>
      <td style="text-align: right">6.73</td>
      <td style="text-align: right">—</td>
    </tr>
    <tr>
      <td><strong>EAGLE3 + TQ k3v4_nc</strong></td>
      <td style="text-align: right">3.54</td>
      <td style="text-align: right">FAILED (OOM)</td>
    </tr>
  </tbody>
</table>

<p><img src="/turboquant-xpu/assets/c1_context_sweep_2026-04-16.png" alt="tok/s vs context length" /></p>

<p><strong>Surprises:</strong></p>

<ul>
  <li>
    <p><strong>suffix+FP16 hits 32.44 tok/s at 32K context.</strong> The repetitive system-prompt padding used to hit the target context size is deeply suffix-tree-friendly — acceptance rate blows up once the tree has seen the padding, and single-request wall time drops. Anyone running a real repetitive-context workload (multi-turn chat against a stable system prompt, RAG against a cached document) may see something similar. For less repetitive workloads, expect numbers closer to the 8K figures.</p>
  </li>
  <li>
    <p><strong>EAGLE3 + TQ is the slowest C=1 config at 8K.</strong> Draft-model compute overhead + TQ dequant on the target. Neither speculative decoding method comes free on TQ. At 32K, the combo OOMs — the EAGLE3 draft’s own KV cache plus TQ-target prefill activations exceed what’s left after weights.</p>
  </li>
  <li>
    <p><strong>TQ’s promised 262K context ceiling never materialized in this session.</strong> Not because KV capacity is the binding resource (the KV budget held 543K tokens of TQ cache at <code class="language-plaintext highlighter-rouge">--max-num-seqs 1</code>) but because prefill activations for a 32K+ prompt exceed the remaining memory on this particular vllm-xpu image. Prefill buffers are proportional to prompt length, not KV compression ratio. A smaller <code class="language-plaintext highlighter-rouge">--max-num-batched-tokens</code> chunk size (chunked prefill is on but defaults are too large) is the likely fix — follow-up work.</p>
  </li>
</ul>

<h2 id="the-fused-n_spec-correctness-regression">The fused-N_spec correctness regression</h2>

<p>The fused-N_spec kernel (<code class="language-plaintext highlighter-rouge">_tq_decode_stage1_spec</code> in <code class="language-plaintext highlighter-rouge">turboquant_xpu.kernels.triton_decode</code>) was the headline of the <a href="/turboquant-xpu/2026/04/14/spec-decode-intel-arc/">previous post</a>: 2.04× speedup at the backend-integration layer for k3v4_nc spec-verify, validated against a looped baseline at <code class="language-plaintext highlighter-rouge">atol=5e-3, rtol=1e-2</code>. Shipping it uncovered two issues that the micro-bench didn’t catch.</p>

<p><strong>First, the dispatch rate is zero under default suffix params.</strong> Suffix decoding with <code class="language-plaintext highlighter-rouge">num_speculative_tokens=8, max_spec_factor=2.0</code> emits <code class="language-plaintext highlighter-rouge">q_len=3</code> consistently when the model’s actual acceptance rate is low (~13-22% per-position on our mixed-prompt set). The fused kernel’s <code class="language-plaintext highlighter-rouge">tl.arange(0, N_SPEC)</code> requires N_SPEC to be a power of 2 — Triton raises <code class="language-plaintext highlighter-rouge">arange's range must be a power of 2</code> for N_SPEC in {3, 5, 6, 7}. So the kernel never fires through the normal suffix path. Added a gate in the backend (<code class="language-plaintext highlighter-rouge">(q_len &amp; (q_len - 1)) == 0</code>) so non-power-of-2 q_lens fall back to the looped kernel transparently instead of crashing.</p>

<p><strong>Second, when forced to fire, the kernel produces wrong outputs.</strong> Bumping <code class="language-plaintext highlighter-rouge">num_speculative_tokens=7, max_spec_factor=30.0</code> forces suffix to emit <code class="language-plaintext highlighter-rouge">q_len=8</code> (7 proposed + 1 verified), which is a power of 2. The fused kernel compiles, the Triton artifact (<code class="language-plaintext highlighter-rouge">_tq_decode_stage1_spec.spv</code>) appears in the cache — and the model generates <code class="language-plaintext highlighter-rouge">"One, two, three, four, five,!!!!!!!!!!!!!!!..."</code> — garbage tokens. Flipping <code class="language-plaintext highlighter-rouge">TQ_USE_FUSED_SPEC=0</code> while keeping the same suffix params produces the correct <code class="language-plaintext highlighter-rouge">"One, two, three, four, five, six, seven, eight, nine, ten, ..."</code> output. The kernel itself, not the dispatch setup, has a numerical regression on XPU.</p>

<p>Why the micro-bench missed it: the bench’s numerical assertion is against a looped-baseline output tensor using <code class="language-plaintext highlighter-rouge">torch.allclose(atol=5e-3)</code>. That tolerance is generous enough to pass the fused output even when it’s silently skipping or mis-masking positions. The deployment-layer failure mode is the next token being wrong, which compounds quickly — fused kernel is flagged as known-broken on XPU until someone tracks down whether it’s a causal-mask broadcast issue, an FP8 bitcast alignment issue, or something else. On the looped path (q_len handled one at a time with per-token <code class="language-plaintext highlighter-rouge">cached_len+n+1</code> seq_lens) generation is correct.</p>

<p><strong>Bottom line:</strong> the 2.04× spec-verify speedup from fused-N_spec is not a shipped optimization on XPU today. What <em>is</em> shipped is the rest of the TurboQuant stack — cache compression, attention backend, suffix/EAGLE3 integration — all of which work correctly at C=1 across the contexts we measured.</p>

<h2 id="decision-matrix-which-config-to-pick-at-c1">Decision matrix: which config to pick at C=1</h2>

<table>
  <thead>
    <tr>
      <th>if you need…</th>
      <th>pick</th>
      <th>because</th>
    </tr>
  </thead>
  <tbody>
    <tr>
      <td>Max single-user throughput, repetitive context</td>
      <td><strong>suffix + FP16</strong></td>
      <td>Suffix tree learns repeated content; 32 tok/s at 32K with stable system prompt</td>
    </tr>
    <tr>
      <td>Consistent throughput across workload types</td>
      <td><strong>EAGLE3 + FP16</strong></td>
      <td>Model-based drafter degrades less on prose. 8-10 tok/s range is predictable</td>
    </tr>
    <tr>
      <td>Maximum context ceiling (theoretical)</td>
      <td><strong>suffix + TQ k3v4_nc</strong></td>
      <td>262K <code class="language-plaintext highlighter-rouge">max-model-len</code>, 543K tokens in KV budget. But prefill OOM is the practical limit until chunked-prefill tuning</td>
    </tr>
    <tr>
      <td>The eventual EAGLE3 + long-context sweet spot</td>
      <td><strong>EAGLE3 + TQ k3v4_nc</strong></td>
      <td>Works at 8K today. 32K+ needs the prefill chunking fix. Monitor.</td>
    </tr>
    <tr>
      <td>Stability above all</td>
      <td><strong>Gemma4 + suffix</strong></td>
      <td>What was running before this session. <code class="language-plaintext highlighter-rouge">switch-model.sh gemma4</code> rolls back.</td>
    </tr>
  </tbody>
</table>

<p>For an Open WebUI / coding-assistant use case, <strong>suffix + FP16</strong> is the best-available single-user config today. For the long-context demo the original spec asked for, the work isn’t done: <code class="language-plaintext highlighter-rouge">--max-num-batched-tokens</code> tuning is the next lever, followed by revisiting <code class="language-plaintext highlighter-rouge">--max-num-seqs</code> once we know the real prefill ceiling per config.</p>

<h2 id="honest-limits">Honest limits</h2>

<ul>
  <li>C=1 only. Concurrency story is in <a href="https://github.com/bryanvine/turboquant-xpu/blob/main/docs/BENCHMARK_QWEN3_30B.md"><code class="language-plaintext highlighter-rouge">BENCHMARK_QWEN3_30B.md</code></a>.</li>
  <li>5-prompt samples, not 16. Numbers have ±10-15% noise at this sample size.</li>
  <li>Prefix caching active — this is a realistic chat/RAG condition but pessimistic for fresh-prefill-per-request workloads.</li>
  <li>128K and 256K contexts couldn’t complete this session. Prefill OOM, not model architecture.</li>
  <li>TTFT not reported. The bench’s streaming TTFT measurement was crashing the engine core under some conditions; the data I have is non-streaming wall time only.</li>
  <li>XPU-specific. NVIDIA ratios will differ, particularly for TQ’s dequant cost relative to FP16.</li>
  <li>The fused-N_spec kernel correctness issue is an XPU finding; NVIDIA numerical behavior is presumably still fine.</li>
</ul>

<h2 id="repro">Repro</h2>

<p>Production config writes through <code class="language-plaintext highlighter-rouge">switch-model.sh</code>. Four modes for the bench:</p>

<div class="language-bash highlighter-rouge"><div class="highlight"><pre class="highlight"><code><span class="nb">cd</span> /apps/b70-vllm
./switch-model.sh qwen3-30b-tq         <span class="c"># suffix + TQ k3v4_nc</span>
./switch-model.sh qwen3-30b-fp16       <span class="c"># suffix + FP16 (65K max-ctx)</span>
./switch-model.sh qwen3-30b-eagle3     <span class="c"># EAGLE3 + FP16 (65K max-ctx)</span>
./switch-model.sh qwen3-30b-eagle3-tq  <span class="c"># EAGLE3 + TQ k3v4_nc (131K max-ctx)</span>
./switch-model.sh gemma4               <span class="c"># rollback to prior production</span>
</code></pre></div></div>

<p>The compose file pins <code class="language-plaintext highlighter-rouge">--max-num-seqs 1</code> for C=1 bench. For production with concurrency, raise it (with per-request max-ctx sized appropriately).</p>

<p>Bench command:</p>

<div class="language-bash highlighter-rouge"><div class="highlight"><pre class="highlight"><code><span class="nb">cd</span> /apps/b70-vllm/turboquant-xpu
.venv-sycl/bin/python scripts/bench_c1_context.py <span class="se">\</span>
  <span class="nt">--mode</span> &lt;mode&gt; <span class="nt">--contexts</span> 8192,32768 <span class="se">\</span>
  <span class="nt">--n-prompts</span> 5 <span class="nt">--skip-ttft</span> <span class="se">\</span>
  <span class="nt">--output</span> docs/tuning/c1_context_sweep_&lt;<span class="nb">date</span><span class="o">&gt;</span>.txt
</code></pre></div></div>

<p>Full deployment source: <a href="https://github.com/bryanvine/turboquant-xpu"><code class="language-plaintext highlighter-rouge">github.com/bryanvine/turboquant-xpu</code></a>. Integration fixes live in <code class="language-plaintext highlighter-rouge">patches/sitecustomize.py</code> and <code class="language-plaintext highlighter-rouge">patches/vllm_mounts/</code>. Mount list is in <code class="language-plaintext highlighter-rouge">/apps/b70-vllm/docker-compose.yml</code> (not in this repo — that directory is host-specific).</p>

<h2 id="whats-next">What’s next</h2>

<p>Two threads open:</p>

<ol>
  <li>
    <p><strong>Long-context deployment isn’t there yet.</strong> <code class="language-plaintext highlighter-rouge">--max-num-batched-tokens</code> tuning + maybe a targeted prefill-activation audit is required to actually deliver the 128K+ single-user contexts that TurboQuant’s KV compression makes architecturally possible on 32 GiB silicon. The KV budget is there; the prefill path is where the constraint lives today.</p>
  </li>
  <li>
    <p><strong>Fused-N_spec kernel correctness.</strong> The XPU Triton build compiles the kernel, passes the micro-bench numerical check, and produces garbage tokens in deployment. Bisecting the inner loop (causal mask broadcast? FP8 bitcast? per-query scratch register pressure spilling?) is the follow-up. Until then, looped is the default.</p>
  </li>
</ol>

<p>Both are concrete next steps for a follow-up post.</p>

<hr />

<p><em>Third post in the Arc B70 series. Repo: <a href="https://github.com/bryanvine/turboquant-xpu">github.com/bryanvine/turboquant-xpu</a>. Prior posts: <a href="/turboquant-xpu/2026/04/14/spec-decode-intel-arc/">April 14</a>, <a href="/turboquant-xpu/2026/04/15/sycl-three-attempts-arc-b70/">April 15</a>.</em></p>]]></content><author><name>Bryan Vine</name></author><category term="intel-arc" /><category term="llm-inference" /><category term="kv-cache" /><category term="turboquant" /><category term="suffix" /><category term="eagle3" /><category term="speculative-decoding" /><category term="qwen3" /><category term="long-context" /><category term="bmg-g31" /><category term="intel-arc-pro-b70" /><summary type="html"><![CDATA[TL;DR]]></summary><media:thumbnail xmlns:media="http://search.yahoo.com/mrss/" url="https://bryanvine.github.io/turboquant-xpu/og-turboquant.png" /><media:content medium="image" url="https://bryanvine.github.io/turboquant-xpu/og-turboquant.png" xmlns:media="http://search.yahoo.com/mrss/" /></entry><entry><title type="html">Three SYCL attempts on Arc B70: ESIMD, joint_matrix, and the gap to Triton</title><link href="https://bryanvine.github.io/turboquant-xpu/2026/04/15/sycl-three-attempts-arc-b70/" rel="alternate" type="text/html" title="Three SYCL attempts on Arc B70: ESIMD, joint_matrix, and the gap to Triton" /><published>2026-04-15T00:00:00+00:00</published><updated>2026-04-15T00:00:00+00:00</updated><id>https://bryanvine.github.io/turboquant-xpu/2026/04/15/sycl-three-attempts-arc-b70</id><content type="html" xml:base="https://bryanvine.github.io/turboquant-xpu/2026/04/15/sycl-three-attempts-arc-b70/"><![CDATA[<h2 id="tldr">TL;DR</h2>

<ul>
  <li>Follow-up to <a href="/2026/04/14/spec-decode-intel-arc/">/2026/04/14/spec-decode-intel-arc/</a> — two more SYCL attempts after the first PoC’s NO-GO. Every number below is at PoC shape: N_spec=8, B=4, Hq=32, Hk=4, D=128, seqlen=8192, causal, cached_len=8184.</li>
  <li><strong>ESIMD via stock 2025.3 <code class="language-plaintext highlighter-rouge">xmx::dpas</code> (Option 5, <a href="https://github.com/bryanvine/turboquant-xpu/tree/esimd-poc"><code class="language-plaintext highlighter-rouge">esimd-poc</code></a> branch):</strong> MARGINAL at 186-192 ms. Faster than scalar SYCL (0.88× zc_scalar on k8v4) but 38-60× slower than fused Triton. Ablation: scalar softmax is 55% of wall time, not the matmul.</li>
  <li><strong><code class="language-plaintext highlighter-rouge">joint_matrix</code> + split-KV via intel/llvm nightly (Option 4 phase a, <a href="https://github.com/bryanvine/turboquant-xpu/tree/sycl-jointmatrix-splitkv"><code class="language-plaintext highlighter-rouge">sycl-jointmatrix-splitkv</code></a> branch, tag <code class="language-plaintext highlighter-rouge">phase-a-decision-2026-04-15</code>):</strong> NO-GO at 96.921 ms, 30× slower than fused Triton’s 3.229 ms. Full DPAS on Q·Kᵀ and P·V fires, correctness 4/4, perf wall is structural.</li>
  <li>Gap-to-fused progression on k8v4: SYCL scalar 68× → ESIMD 60× → joint_matrix 30×. ESIMD closed ~14% of the original wall-time gap; joint_matrix+split-KV roughly halved what ESIMD left. The 30× that remains is out of reach for phase (b)’s plausible 3-10× combined.</li>
  <li>Three hardware/toolchain findings worth documenting: nightly header requires <code class="language-plaintext highlighter-rouge">jm::layout::dynamic</code> on accumulator fragments, <code class="language-plaintext highlighter-rouge">joint_matrix_load/store</code> reject <code class="language-plaintext highlighter-rouge">private_space</code> via <code class="language-plaintext highlighter-rouge">static_assert</code> (forced SLM staging + lane-0 serialization), and — most important — Intel’s Triton XPU backend already emits DPAS, so custom-DPAS isn’t the lever.</li>
  <li>Fused Triton causal at 3.229 ms stays load-bearing for production. Repo at <a href="https://github.com/bryanvine/turboquant-xpu">github.com/bryanvine/turboquant-xpu</a>; the three branches (<code class="language-plaintext highlighter-rouge">sycl-poc</code>, <code class="language-plaintext highlighter-rouge">esimd-poc</code>, <code class="language-plaintext highlighter-rouge">sycl-jointmatrix-splitkv</code>) are preserved with decision writeups.</li>
</ul>

<h2 id="part-1-context-recap">Part 1: Context recap</h2>

<p>The <a href="/2026/04/14/spec-decode-intel-arc/">original post</a> covered the first SYCL PoC (scalar + DPAS on the <a href="https://github.com/bryanvine/turboquant-xpu/tree/sycl-poc"><code class="language-plaintext highlighter-rouge">sycl-poc</code></a> branch, NO-GO at commit <a href="https://github.com/bryanvine/turboquant-xpu/commit/796f7df"><code class="language-plaintext highlighter-rouge">796f7df</code></a>), the Triton profile that exposed a 24% Level-Zero dispatch tax, and the fused-N_spec Triton kernel that closed it — 2.04× on k3v4_nc and 1.07× on k8v4 at the backend-integration layer. That post closed with “thesis untested”: the PoC’s scalar baseline was missing split-KV, SIMD cooperation, and SLM reuse, so showing DPAS on top didn’t prove anything about whether a production-grade SYCL kernel could beat Triton.</p>

<p>Two follow-ups took opposite paths at resolving that ambiguity.</p>

<p><strong>ESIMD (Option 5)</strong> sidestepped the toolchain problem. Stock oneAPI 2025.3’s <code class="language-plaintext highlighter-rouge">libsycl.so.8</code> doesn’t have BMG-G31 in <code class="language-plaintext highlighter-rouge">get_matrix_combinations()</code> for <code class="language-plaintext highlighter-rouge">joint_matrix</code>, but <code class="language-plaintext highlighter-rouge">xmx::dpas</code> intrinsics work without needing the <code class="language-plaintext highlighter-rouge">joint_matrix</code> entry point. No nightly, no ABI split, no subprocess bridge. If <code class="language-plaintext highlighter-rouge">xmx::dpas</code> alone closed the gap, that was the cheapest answer possible.</p>

<p><strong><code class="language-plaintext highlighter-rouge">joint_matrix</code> + split-KV (Option 4 phase a)</strong> built what the original PoC skipped. Two-stage kernel with <code class="language-plaintext highlighter-rouge">NUM_KV_SPLITS=8</code> parallel work-items per <code class="language-plaintext highlighter-rouge">(b, h_q)</code>, portable <code class="language-plaintext highlighter-rouge">joint_matrix</code> DPAS for both Q·Kᵀ and P·V, running on the intel/llvm nightly (with the same subprocess-bridge workaround as the first PoC). The feasibility doc’s <a href="https://github.com/bryanvine/turboquant-xpu/blob/main/docs/CUSTOM_KERNEL_FEASIBILITY.md"><code class="language-plaintext highlighter-rouge">CUSTOM_KERNEL_FEASIBILITY.md</code></a> projection was 2.5-4× over Triton; the phase-a gate was set at ≤30 ms wall time as a less ambitious stepping stone.</p>

<p>Both follow-ups were contained go/no-go PoCs — each answered one scoped question and stopped. This post covers both, summarizes what each measured, maps the findings against the feasibility doc’s projection, and closes with the lessons that apply to anyone attempting BMG-G31 kernel work.</p>

<h2 id="part-2-esimd-via-stock-20253-xmxdpas">Part 2: ESIMD via stock 2025.3 <code class="language-plaintext highlighter-rouge">xmx::dpas</code></h2>

<p><strong>Why ESIMD.</strong> Stock oneAPI 2025.3’s <code class="language-plaintext highlighter-rouge">icpx</code> compiles <code class="language-plaintext highlighter-rouge">xmx::dpas&lt;8,8,float,float,half,half&gt;</code> on BMG-G31 cleanly — no nightly toolchain, no <code class="language-plaintext highlighter-rouge">LIBUR_LOADER</code> version conflict, no subprocess bridge. The first PoC needed the intel/llvm nightly and its <code class="language-plaintext highlighter-rouge">libsycl.so.9</code> precisely because <code class="language-plaintext highlighter-rouge">joint_matrix</code> wasn’t in 2025.3’s <code class="language-plaintext highlighter-rouge">get_matrix_combinations()</code> table for BMG-G31; <code class="language-plaintext highlighter-rouge">xmx::dpas</code> intrinsics bypass that entry point entirely. If <code class="language-plaintext highlighter-rouge">xmx::dpas</code> alone closed the gap, that was the simplest answer possible.</p>

<p><strong>What landed.</strong> The pybind module <code class="language-plaintext highlighter-rouge">turboquant_xpu_esimd</code> (at <code class="language-plaintext highlighter-rouge">sycl/esimd/</code>, built with stock 2025.3 <code class="language-plaintext highlighter-rouge">icpx</code>) launches one ESIMD thread per <code class="language-plaintext highlighter-rouge">(b, h_q)</code> — for the PoC shape that’s B·Hq = 128 SIMD threads total. K and V tiles live in per-thread registers (<code class="language-plaintext highlighter-rouge">simd&lt;half, 2048&gt;</code> fits within the per-thread register budget, trading SLM staging for simpler code). Both Q·Kᵀ and P·V use <code class="language-plaintext highlighter-rouge">xmx::dpas&lt;8,8,float,float,half,half&gt;</code>; softmax runs scalar. All 8 correctness parametrizations pass (2 presets × parallel+causal × small+poc shape, tolerance <code class="language-plaintext highlighter-rouge">atol=5e-3, rtol=1e-2</code>). Branch: <a href="https://github.com/bryanvine/turboquant-xpu/tree/esimd-poc"><code class="language-plaintext highlighter-rouge">esimd-poc</code></a>.</p>

<p><strong>Bench table.</strong> Causal mode, PoC shape (N_spec=8, B=4, Hq=32, Hk=4, D=128, seqlen=8192, cached_len=8184). Warmup 5 / timed 20 (Triton legs timed 10).</p>

<table>
  <thead>
    <tr>
      <th>preset</th>
      <th style="text-align: right">triton×N</th>
      <th style="text-align: right">zc_scalar</th>
      <th style="text-align: right">fused_trit</th>
      <th style="text-align: right">esimd</th>
      <th style="text-align: right">esimd/zc</th>
      <th style="text-align: right">esimd/fused</th>
    </tr>
  </thead>
  <tbody>
    <tr>
      <td>k8v4</td>
      <td style="text-align: right">8.95 ms</td>
      <td style="text-align: right">218.49 ms</td>
      <td style="text-align: right">3.21 ms</td>
      <td style="text-align: right"><strong>192.22 ms</strong></td>
      <td style="text-align: right">0.88×</td>
      <td style="text-align: right">59.8×</td>
    </tr>
    <tr>
      <td>k3v4_nc</td>
      <td style="text-align: right">13.72 ms</td>
      <td style="text-align: right">248.56 ms</td>
      <td style="text-align: right">4.83 ms</td>
      <td style="text-align: right"><strong>186.38 ms</strong></td>
      <td style="text-align: right">0.75×</td>
      <td style="text-align: right">38.6×</td>
    </tr>
  </tbody>
</table>

<p>ESIMD beat scalar SYCL by 12–25% — DPAS is doing useful work. It did not meet the plan’s 2× bar over zc_scalar, and it landed 39–60× slower than fused Triton. The plan’s hard GO criterion (ESIMD ≤ 0.5× zc_scalar) is not met; the hard NO-GO criterion (&gt;0.8× on both presets) is also not quite met at 0.75× on k3v4_nc.</p>

<p><strong>The diagnostic — ablation profile.</strong> Ablating each component one at a time (disable, measure, restore) against the 190 ms wall time: ~55% scalar softmax, ~48% K dequant, ~47% V dequant, ~51% DPAS Q·Kᵀ, ~31% DPAS P·V. The percentages sum above 100% because ablation doesn’t serialize perfectly — each figure is that component’s measured contribution when it was the one disabled. The reading is unambiguous: DPAS fires, DPAS is not the bottleneck. Scalar softmax and the two dequant paths account for roughly half of wall time each, and they run outside the matrix units entirely.</p>

<p><strong>The mid-PoC 2.4× fix.</strong> The initial kernel body was adapted from Task 5’s correctness-only scaffold, which included a <code class="language-plaintext highlighter-rouge">lane != 0 return</code> guard — a pattern that makes sense in a correctness test that wants exactly one result but is a disaster in production: 15 of the 16 SIMD lanes in every work-group returned immediately, leaving the hardware 94% idle. Removing the guard cut wall time from 436 ms to ~190 ms, a 2.4× improvement with no correctness change. The lesson: correctness scaffolds accumulate perf disasters by design, and every one of them needs an explicit audit before any benchmark is meaningful.</p>

<p><strong>Decision: MARGINAL, leaning NO-GO.</strong> The ESIMD writeup’s own honest-unknowns section flags the structural ceiling: Intel’s Triton XPU backend already emits DPAS. Triton’s fused kernel at 3–5 ms encodes much of what ESIMD+DPAS is supposed to enable, and without a specific piece of ESIMD-only hardware control that DPAS-via-Triton can’t access, the realistic upper bound for a fully optimized ESIMD port is much closer to Triton’s 3 ms than to the 0.5–1 ms that dedicated ESIMD could theoretically reach with perfect register utilization and vectorized softmax. Branch parked with <a href="https://github.com/bryanvine/turboquant-xpu/blob/esimd-poc/docs/ESIMD_POC_RESULTS.md"><code class="language-plaintext highlighter-rouge">docs/ESIMD_POC_RESULTS.md</code></a> recording the decision.</p>

<h2 id="part-3-joint_matrix--split-kv-via-intelllvm-nightly">Part 3: <code class="language-plaintext highlighter-rouge">joint_matrix</code> + split-KV via intel/llvm nightly</h2>

<p><strong>Why try again.</strong> The ESIMD ablation was instructive: DPAS fires, but the 55% scalar-softmax and dual dequant bottlenecks are structural, not tuning nits. ESIMD deliberately avoided three structural optimizations — split-KV parallelism across work-items, cross-thread SLM K-tile reuse, and vectorized softmax — trading SLM for register-resident tiles to keep the first PoC simple. Phase (a) was scoped as “build the structural prerequisites, measure, decide” with a ≤30 ms gate. That gate is a less ambitious stepping stone than the <a href="https://github.com/bryanvine/turboquant-xpu/blob/sycl-jointmatrix-splitkv/docs/superpowers/specs/2026-04-14-sycl-jointmatrix-splitkv.md">feasibility doc’s 2.5–4× over-fused projection</a> — the <a href="https://github.com/bryanvine/turboquant-xpu/blob/sycl-jointmatrix-splitkv/docs/superpowers/plans/2026-04-14-sycl-jm-phase-a.md">plan</a> explicitly sets a three-band rubric (GO / MARGINAL / NO-GO) with 30 ms as the cutoff for continuing to phase (b).</p>

<p><strong>What landed.</strong> Two-stage kernel: stage 1 dispatches <code class="language-plaintext highlighter-rouge">NUM_KV_SPLITS=8</code> parallel work-items per <code class="language-plaintext highlighter-rouge">(b, h_q)</code> — each work-item handles its seqlen slice, computes Q·Kᵀ via <code class="language-plaintext highlighter-rouge">joint_matrix</code> DPAS, runs softmax, then computes P·V via <code class="language-plaintext highlighter-rouge">joint_matrix</code> DPAS, and writes partials to USM; stage 2 is a scalar log-sum-exp reduce over the 8 splits. Toolchain: intel/llvm nightly 2026-04-13 (clang 23). A subprocess bridge keeps the nightly’s <code class="language-plaintext highlighter-rouge">libsycl.so.9</code> out of the torch-XPU process; <code class="language-plaintext highlighter-rouge">.venv-jm/</code> is numpy-only — no torch dependency in the kernel harness. Tag: <a href="https://github.com/bryanvine/turboquant-xpu/releases/tag/phase-a-decision-2026-04-15"><code class="language-plaintext highlighter-rouge">phase-a-decision-2026-04-15</code></a>. Execution via <code class="language-plaintext highlighter-rouge">superpowers:subagent-driven-development</code>. Correctness: 4/4 parametrizations pass at <code class="language-plaintext highlighter-rouge">atol=5e-3, rtol=1e-2</code> (2 shapes × parallel + causal, k8v4 preset).</p>

<p><strong>Toolchain findings worth writing down.</strong> Three API constraints the feasibility doc couldn’t predict — each caught during implementation and each changed the kernel in a concrete way.</p>

<p><strong><code class="language-plaintext highlighter-rouge">jm::layout::dynamic</code> required for accumulator fragments.</strong> The nightly’s <code class="language-plaintext highlighter-rouge">matrix-unified.hpp</code> binds the accumulator-variant <code class="language-plaintext highlighter-rouge">joint_matrix_load</code> and <code class="language-plaintext highlighter-rouge">joint_matrix_store</code> signatures to <code class="language-plaintext highlighter-rouge">layout::dynamic</code>. Omitting the layout template parameter is a compile error, not a silent default. Caught during smoke-test compilation; fixed by adding the explicit <code class="language-plaintext highlighter-rouge">layout::dynamic</code> parameter to every accumulator load and store.</p>

<p><strong><code class="language-plaintext highlighter-rouge">joint_matrix_load/store</code> reject <code class="language-plaintext highlighter-rouge">private_space</code> via hard <code class="language-plaintext highlighter-rouge">static_assert</code>.</strong> Three separate <code class="language-plaintext highlighter-rouge">static_assert</code>s in the nightly header all reject <code class="language-plaintext highlighter-rouge">access::address_space::private_space</code> with the message “Joint Matrix doesn’t support load from private memory!”. Stack-allocated scratch arrays fail at compile — there is no runtime fallback. Task 7’s kernel swapped every scratch buffer to <code class="language-plaintext highlighter-rouge">sycl::local_accessor</code> with <code class="language-plaintext highlighter-rouge">local_space</code> address casts. Total SLM for Task 8 = 12.75 KB per sub-group across 9 buffers (2 KB Q, 4 KB K tile, 512 B b_tile transpose, 512 B scores, 4 KB V tile, 256 B P buffer, 512 B b_pv transpose, 512 B acc_in, 512 B acc_out) — well within the 64 KB BMG-G31 budget, but the change is materially structural: lane-0-only SLM fills plus <code class="language-plaintext highlighter-rouge">sycl::group_barrier(sg)</code> after each write replace per-work-item private registers, serializing the sub-group on every tile load.</p>

<p><strong><code class="language-plaintext highlighter-rouge">joint_matrix_mad</code> arg order is <code class="language-plaintext highlighter-rouge">(sg, D, A, B, C)</code> for <code class="language-plaintext highlighter-rouge">D = A*B + C</code>.</strong> Verified in the nightly header; confirmed via the smoke test’s <code class="language-plaintext highlighter-rouge">max_err=0</code> against a CPU reference. Mentioned here because older intel/llvm examples had the arg order reversed — silent wrong answers, not a compile error.</p>

<p><strong>Per-task timing progression.</strong> Commit-by-commit at PoC shape (N_spec=8, B=4, Hq=32, Hk=4, D=128, seqlen=8192, causal, cached_len=8184, k8v4). Source: <a href="https://github.com/bryanvine/turboquant-xpu/blob/sycl-jointmatrix-splitkv/docs/tuning/sycl_jm_per_task_timings_2026-04-15.md"><code class="language-plaintext highlighter-rouge">docs/tuning/sycl_jm_per_task_timings_2026-04-15.md</code></a>.</p>

<table>
  <thead>
    <tr>
      <th>task</th>
      <th>kernel state</th>
      <th>commit</th>
      <th style="text-align: right">ms_per_iter</th>
    </tr>
  </thead>
  <tbody>
    <tr>
      <td>6</td>
      <td>scalar split-KV (no DPAS)</td>
      <td><a href="https://github.com/bryanvine/turboquant-xpu/commit/7a0efac"><code class="language-plaintext highlighter-rouge">7a0efac</code></a></td>
      <td style="text-align: right">223.3</td>
    </tr>
    <tr>
      <td>7</td>
      <td>+ Q·Kᵀ DPAS</td>
      <td><a href="https://github.com/bryanvine/turboquant-xpu/commit/53fb11d"><code class="language-plaintext highlighter-rouge">53fb11d</code></a></td>
      <td style="text-align: right">244.3</td>
    </tr>
    <tr>
      <td>8</td>
      <td>+ P·V DPAS (phase a complete)</td>
      <td><a href="https://github.com/bryanvine/turboquant-xpu/commit/f9c4292"><code class="language-plaintext highlighter-rouge">f9c4292</code></a></td>
      <td style="text-align: right">96.9</td>
    </tr>
  </tbody>
</table>

<p>Task 6 → Task 7 is a small regression. DPAS for Q·Kᵀ replaced an 8192-iteration scalar inner loop, but the lane-0-only SLM fill pattern the nightly’s <code class="language-plaintext highlighter-rouge">static_assert</code> forced — Q, K tile, and per-d_slice b_tile pre-transpose, each followed by a sub-group barrier — added enough serialized overhead to net-regress by 21 ms. Task 7 → Task 8 is the opposite: DPAS for P·V replaced a 1024-iteration scalar <code class="language-plaintext highlighter-rouge">acc[n][d] += p*v[d]</code> accumulation per row per KV block. That inner loop dominated Task 7’s wall time, and replacing it was decisive — a 2.5× drop from 244.3 ms to 96.9 ms.</p>

<p><strong>Bench at PoC shape, k8v4 causal.</strong> Source: <a href="https://github.com/bryanvine/turboquant-xpu/blob/sycl-jointmatrix-splitkv/docs/tuning/sycl_jm_bench_2026-04-15.txt"><code class="language-plaintext highlighter-rouge">docs/tuning/sycl_jm_bench_2026-04-15.txt</code></a>. Warmup 5 / timed 20.</p>

<table>
  <thead>
    <tr>
      <th>leg</th>
      <th style="text-align: right">ms</th>
    </tr>
  </thead>
  <tbody>
    <tr>
      <td>fused_trit</td>
      <td style="text-align: right"><strong>3.229</strong></td>
    </tr>
    <tr>
      <td>triton×N</td>
      <td style="text-align: right">18.516</td>
    </tr>
    <tr>
      <td>sycl_jm</td>
      <td style="text-align: right"><strong>96.921</strong></td>
    </tr>
    <tr>
      <td>zc_scalar</td>
      <td style="text-align: right">218.066</td>
    </tr>
  </tbody>
</table>

<p><code class="language-plaintext highlighter-rouge">sycl_jm / fused_trit = 30.02×</code>. The phase-a gate was ≤30 ms. Missed by 3.2×.</p>

<p><strong>Decision: PHASE (A) NO-GO.</strong> Reference: <a href="https://github.com/bryanvine/turboquant-xpu/blob/sycl-jointmatrix-splitkv/docs/SYCL_JM_POC_RESULTS.md"><code class="language-plaintext highlighter-rouge">docs/SYCL_JM_POC_RESULTS.md</code></a>. At 96.921 ms, sycl_jm is technically in the plan’s 30–100 ms MARGINAL band — but the 30× gap to fused Triton, not the raw millisecond figure, drives the decision. The plan’s MARGINAL-to-GO path requires a specific, plausible route to a large speedup. Phase (b) has five candidate optimizations: SIMD16 cooperation for dequant + softmax, SLM K-tile reuse across queries, keeping <code class="language-plaintext highlighter-rouge">mc_out[N_D_SLICES]</code> in fragments across KV blocks (eliminating the <code class="language-plaintext highlighter-rouge">acc_scalar</code> round-trip), <code class="language-plaintext highlighter-rouge">joint_matrix_apply</code> for in-fragment rescale, and <code class="language-plaintext highlighter-rouge">NUM_KV_SPLITS</code> autotune. Published-literature range for each: 1.5–3×. Combined best case: 3–10× — they share overhead, so not multiplicative. Even a 10× combined improvement brings sycl_jm to ~9.7 ms, still 3× slower than fused Triton’s 3.229 ms. Reaching parity requires ~30× from phase (b) alone. That is not achievable from the phase (b) menu. Branch and tag pushed to origin; phase (b) is not scheduled.</p>

<h2 id="part-4-the-diagnostic-map">Part 4: The diagnostic map</h2>

<p>Each attempt closed some of the gap to fused Triton but hit a different ceiling. I put the three attempts side-by-side at the k8v4 preset — the only shape all three legs cover.</p>

<table>
  <thead>
    <tr>
      <th>attempt</th>
      <th>branch</th>
      <th>toolchain</th>
      <th style="text-align: right">wall at PoC k8v4 causal</th>
      <th style="text-align: right">gap to fused Triton</th>
      <th>dominant bottleneck</th>
    </tr>
  </thead>
  <tbody>
    <tr>
      <td>SYCL scalar + DPAS (original PoC, post zero-copy)</td>
      <td><a href="https://github.com/bryanvine/turboquant-xpu/tree/sycl-poc"><code class="language-plaintext highlighter-rouge">sycl-poc</code></a></td>
      <td>stock 2025.3 icpx</td>
      <td style="text-align: right">~219 ms</td>
      <td style="text-align: right">~68×</td>
      <td>no split-KV, no SIMD cooperation, no SLM reuse</td>
    </tr>
    <tr>
      <td>ESIMD <code class="language-plaintext highlighter-rouge">xmx::dpas</code></td>
      <td><a href="https://github.com/bryanvine/turboquant-xpu/tree/esimd-poc"><code class="language-plaintext highlighter-rouge">esimd-poc</code></a></td>
      <td>stock 2025.3 icpx</td>
      <td style="text-align: right">~192 ms</td>
      <td style="text-align: right">~60×</td>
      <td>scalar softmax, scalar-per-element <code class="language-plaintext highlighter-rouge">simd&lt;&gt;</code> access</td>
    </tr>
    <tr>
      <td><code class="language-plaintext highlighter-rouge">joint_matrix</code> + split-KV (phase a)</td>
      <td><a href="https://github.com/bryanvine/turboquant-xpu/tree/sycl-jointmatrix-splitkv"><code class="language-plaintext highlighter-rouge">sycl-jointmatrix-splitkv</code></a></td>
      <td>intel/llvm nightly</td>
      <td style="text-align: right">96.9 ms</td>
      <td style="text-align: right">30×</td>
      <td>lane-0 serial SLM fill, <code class="language-plaintext highlighter-rouge">acc_scalar</code> round-trip, probable register spill</td>
    </tr>
  </tbody>
</table>

<p>The two transitions did not return equal amounts. From zero-copy scalar to ESIMD — swapping the scalar inner products for <code class="language-plaintext highlighter-rouge">xmx::dpas</code> register-resident Q·Kᵀ and P·V tile operations — wall time dropped from ~219 ms to ~192 ms, a 14% reduction and a gap compression from 68× to 60×. DPAS fired, the register-resident K and V tiles were coherent, and correctness held across all 8 parametrizations. But the structural work — split-KV parallelism, SLM K-tile sharing, vectorized softmax — was explicitly absent, and the ablation made clear where the 190 ms was going: scalar softmax alone accounted for ~55% of wall time.</p>

<p>The move from ESIMD to <code class="language-plaintext highlighter-rouge">joint_matrix</code> + split-KV delivered the much larger structural win. The 8× grid expansion (NUM_KV_SPLITS=8 work-items per (b, h_q)), combined with <code class="language-plaintext highlighter-rouge">joint_matrix</code> DPAS collectives for both Q·Kᵀ and P·V replacing their respective scalar inner loops, cut wall time from ~192 ms to 96.9 ms — a 49% wall reduction and a gap compression from 60× to 30×. That is roughly halving what ESIMD left. The task-level timing makes the P·V contribution concrete: Task 7 → Task 8 (adding P·V DPAS) was a 2.5× drop from 244.3 ms to 96.9 ms, while Task 6 → Task 7 (adding Q·Kᵀ DPAS) actually regressed by 21 ms.</p>

<p>The ceilings at each step map to different hardware resources. <strong>Scalar SYCL:</strong> D=128 FMAs per token in scalar — no matrix unit contact, no SLM reuse, no cross-work-item parallelism. <strong>ESIMD:</strong> DPAS fires but scalar softmax runs outside the matrix units, and ~128 threads across 32 Xe-cores leaves roughly 4 SIMD threads per core. Per-element <code class="language-plaintext highlighter-rouge">simd&lt;&gt;</code> VNNI packing serializes inside each lane. <strong><code class="language-plaintext highlighter-rouge">joint_matrix</code> + split-KV:</strong> the nightly’s <code class="language-plaintext highlighter-rouge">static_assert</code> rejection of <code class="language-plaintext highlighter-rouge">private_space</code> forces lane-0-only SLM fills plus a sub-group barrier after each tile write, serializing every load. The per-d_slice <code class="language-plaintext highlighter-rouge">acc_scalar</code> round-trip (fragment → private scalar array → back) adds a register-to-ALU-to-register cycle per slice; the <code class="language-plaintext highlighter-rouge">acc_scalar[M_TILE=8][D_DIM=128]</code> fp32 array is 4 KB per work-item — enough to trigger register spill on BMG-G31’s 256 KB register file shared across the sub-group.</p>

<p>None of the three attempts were throughput-bound on DPAS. Every ceiling — scalar inner products, scalar softmax, serial SLM fills, <code class="language-plaintext highlighter-rouge">acc_scalar</code> round-trips — is non-DPAS work. The feasibility doc’s 2.5–4× projection cited DPAS as the primary lever. All three attempts agree it is not. I keep coming back to that consensus: the lever the feasibility doc identified is not the limiting one.</p>

<h2 id="part-5-revisiting-the-feasibility-docs-25-4-projection">Part 5: Revisiting the feasibility doc’s 2.5-4× projection</h2>

<p>The feasibility doc’s <a href="https://github.com/bryanvine/turboquant-xpu/blob/main/docs/CUSTOM_KERNEL_FEASIBILITY.md">2.5-4× projection</a> was reasonable given its assumptions. The three attempts disagreed with four of those assumptions. Each optimism source below is grounded in measured evidence.</p>

<p><strong>Reason 1: Baseline anchor moved.</strong> The 2.5-4× was against the looped Triton path (~9-14 ms at the time of the doc). Fused Triton — shipped with the original post at <a href="https://github.com/bryanvine/turboquant-xpu/commit/425fc5c"><code class="language-plaintext highlighter-rouge">425fc5c</code></a> — is 3.229 ms on k8v4 causal, a 2.7-4.2× reduction that captured most of the projected gain from a Python→kernel-fusion angle. Custom SYCL now has to beat ~3 ms to show value, not ~10 ms. That is a 3-4× tighter budget than the projection assumed.</p>

<p><strong>Reason 2: Triton on Xe2 already emits DPAS.</strong> Intel’s <code class="language-plaintext highlighter-rouge">intel-xpu-backend-for-triton</code> lowers <code class="language-plaintext highlighter-rouge">tl.dot</code> to <code class="language-plaintext highlighter-rouge">joint_matrix</code> operations on Xe2. Custom SYCL DPAS isn’t bringing a hardware capability Triton lacks — it’s bringing finer manual control. The ESIMD writeup said so explicitly: “If Triton’s DPAS is already optimal for this shape, ESIMD’s upper bound is much closer to Triton’s 3 ms than the 0.5-1 ms that dedicated ESIMD could theoretically deliver.” Phase (a) confirmed it from the <code class="language-plaintext highlighter-rouge">joint_matrix</code> side: explicit <code class="language-plaintext highlighter-rouge">joint_matrix_mad</code> for both GEMMs landed 30× off fused Triton. DPAS is not the lever that moves the number.</p>

<p><strong>Reason 3: Scalar softmax and dequant are the real wall.</strong> The ESIMD ablation decomposed wall time at 55% scalar softmax, 47% K dequant, and 47% V dequant — each individually larger than the DPAS contributions (51% Q·Kᵀ, 31% P·V). Phase (a) measured the same thing from the toolchain side: lane-0 serial SLM fills for Q, K dequant, V dequant, and <code class="language-plaintext highlighter-rouge">p_buf</code>, plus <code class="language-plaintext highlighter-rouge">acc_scalar</code> round-trips for rescale, all pile up faster than the DPAS mads drain. The feasibility doc implicitly assumed DPAS-centric work dominated; the measurement says it’s closer to 50/50, and DPAS isn’t the majority.</p>

<p><strong>Reason 4: Hardware constraints only visible once you hit them.</strong> Three surfaced in phase (a). First: <code class="language-plaintext highlighter-rouge">joint_matrix_load/store</code> reject <code class="language-plaintext highlighter-rouge">private_space</code> via hard <code class="language-plaintext highlighter-rouge">static_assert</code> — every scratch buffer has to live in SLM, forcing lane-0-only fills plus barriers, serializing what was supposed to be collective work. Second: <code class="language-plaintext highlighter-rouge">acc_scalar[M_TILE=8][D_DIM=128]</code> fp32 per work-item is 4 KB of per-thread live state; Xe2’s per-thread register budget is ~8 KB at full occupancy — probable spill, though I didn’t extract a register report. Third: the lane-0-serialized fill pattern turns a 16-lane sub-group into 1-lane-plus-15-waiting for the non-DPAS stages. The ESIMD PoC hit the same trap in a different shape — the mid-PoC 2.4× fix removed a <code class="language-plaintext highlighter-rouge">lane != 0 return</code> guard that was idling 15 of 16 threads; phase (a) hit it again because writing cooperative fills is a rewrite, not a knob.</p>

<p>The 2.5-4× projection assumed (a) the looped-Triton baseline, (b) DPAS as the dominant lever, (c) scalar softmax as negligible, and (d) independent compounding optimizations. All four failed under measurement. The projection wasn’t wrong in spirit — a production-grade SYCL kernel with all five structural wins plus vectorized softmax plus AOT-tuned SLM reuse could potentially beat Triton on Xe2. What the three PoCs established is that no scoped go/no-go milestone inside the phased commitment reached that ceiling: each PoC answered its question and each returned NO-GO. A full production build would be a larger scope — the joint_matrix spec labels phase (c) “open-ended” — and against a fused Triton target that keeps improving, the three attempts never found an intermediate decision point where the numbers justified the next step.</p>

<h2 id="part-6-lessons">Part 6: Lessons</h2>

<ul>
  <li>
    <p><strong>Sidestepping toolchain issues can also sidestep the problem.</strong> ESIMD stayed on stock oneAPI 2025.3 + <code class="language-plaintext highlighter-rouge">xmx::dpas</code> and avoided the nightly/ABI split entirely. It also avoided every structural optimization that gave Triton its edge. Toolchain cost and algorithmic cost aren’t independent; the path of least toolchain resistance often skips the algorithm that would have mattered. Choosing ESIMD for stability was defensible — but the choice bought predictability at the price of the structural optimizations that were the whole point.</p>
  </li>
  <li>
    <p><strong>The scalar softmax is the real ceiling.</strong> Both the ESIMD ablation and the joint_matrix phase (a) timing point at the same place: non-DPAS compute — softmax, dequant, rescale round-trips — dominates once the matrix contractions are fast. A custom kernel wins when it beats Triton across the whole pipeline, not just the GEMM slices. Any future attempt should scope vectorized softmax into the first PoC, not defer it as phase (b) cleanup. It’s the gate, not the garnish.</p>
  </li>
  <li>
    <p><strong>Register budget and SLM discipline compound — in the wrong direction.</strong> The <code class="language-plaintext highlighter-rouge">acc_scalar[8][128]</code> fp32 stack array in phase (a) is roughly 4 KB per work-item and probable spill territory on Xe2’s ~8 KB per-thread budget at full occupancy. The phase (b) plan’s “keep <code class="language-plaintext highlighter-rouge">mc_out</code> in fragments across KV blocks” avoids exactly this pattern. Structural choices aren’t autotuneable; you pay for them whether or not you’ve measured them, and the cost compounds across every iteration of the outer KV loop.</p>
  </li>
  <li>
    <p><strong>Correctness scaffolds turn into perf disasters.</strong> The ESIMD PoC’s <code class="language-plaintext highlighter-rouge">lane != 0 return</code> guard — inherited from the single-lane correctness scaffold — idled 15 of 16 SIMD threads per work-group for the entire benchmark. Removing it cut wall time 2.4× with no correctness change. The guard made sense when validating output; it became a silent performance floor once validation passed. Prune correctness-only guards before running the perf benchmark, not after you’ve already filed the results.</p>
  </li>
  <li>
    <p><strong>Publish each negative result with its specific next-step cost.</strong> Tag <a href="https://github.com/bryanvine/turboquant-xpu/releases/tag/phase-a-decision-2026-04-15"><code class="language-plaintext highlighter-rouge">phase-a-decision-2026-04-15</code></a> and <a href="https://github.com/bryanvine/turboquant-xpu/blob/sycl-jointmatrix-splitkv/docs/SYCL_JM_POC_RESULTS.md"><code class="language-plaintext highlighter-rouge">SYCL_JM_POC_RESULTS.md</code></a> record the exact phase (b) optimization list with projected per-item speedups. Anyone resuming — or Intel’s team looking at the work — knows what to try and what it would plausibly be worth before committing effort. A negative result without a cost-tagged next step is just a dead end; a negative result with one is a decision tree node.</p>
  </li>
</ul>

<h2 id="part-7-closing">Part 7: Closing</h2>

<p>Three attempts, one pattern: DPAS fires every time, and non-DPAS work is the ceiling every time. Scalar softmax at 55% of wall time, lane-0 SLM fills, <code class="language-plaintext highlighter-rouge">acc_scalar</code> round-trips — none of these are what the feasibility doc pointed at, and none of them yielded to DPAS tuning. The fused Triton kernel at 3.229 ms stays load-bearing. The 2.04× on k3v4_nc and 1.07× on k8v4 at the backend-integration layer are the numbers that matter, and <code class="language-plaintext highlighter-rouge">TQ_USE_FUSED_SPEC=1</code> remains the recommended production setting.</p>

<p><a href="https://github.com/vllm-project/vllm-xpu-kernels/issues/271">Issue #271</a> on <code class="language-plaintext highlighter-rouge">vllm-project/vllm-xpu-kernels</code> is the plausible path that actually beats Triton — a SYCL kernel with vectorized softmax, AOT-tuned SLM reuse, and persistent-fragment accumulators is what none of the three PoCs delivered. The caveat is honest: the three attempts together suggest the path is narrower than the feasibility doc estimated, and the target keeps moving — Intel’s Triton XPU backend’s DPAS lowering keeps improving, which means every iteration of custom SYCL has to clear a bar that Triton raises from below. If Intel ships that kernel, that’s the one to watch.</p>

<p>All three branches are preserved with decision writeups: <a href="https://github.com/bryanvine/turboquant-xpu/tree/sycl-poc"><code class="language-plaintext highlighter-rouge">sycl-poc</code></a>, <a href="https://github.com/bryanvine/turboquant-xpu/tree/esimd-poc"><code class="language-plaintext highlighter-rouge">esimd-poc</code></a>, <a href="https://github.com/bryanvine/turboquant-xpu/tree/sycl-jointmatrix-splitkv"><code class="language-plaintext highlighter-rouge">sycl-jointmatrix-splitkv</code></a>. Repo: <a href="https://github.com/bryanvine/turboquant-xpu">github.com/bryanvine/turboquant-xpu</a>.</p>]]></content><author><name>Bryan Vine</name></author><category term="intel-arc" /><category term="llm-inference" /><category term="kernels" /><category term="sycl" /><category term="esimd" /><category term="joint-matrix" /><category term="dpas" /><category term="turboquant" /><category term="bmg-g31" /><category term="intel-arc-pro-b70" /><summary type="html"><![CDATA[TL;DR]]></summary><media:thumbnail xmlns:media="http://search.yahoo.com/mrss/" url="https://bryanvine.github.io/turboquant-xpu/og-turboquant.png" /><media:content medium="image" url="https://bryanvine.github.io/turboquant-xpu/og-turboquant.png" xmlns:media="http://search.yahoo.com/mrss/" /></entry><entry><title type="html">Speculative decoding on Intel Arc: a failed SYCL PoC and a 2x Triton fix</title><link href="https://bryanvine.github.io/turboquant-xpu/2026/04/14/spec-decode-intel-arc/" rel="alternate" type="text/html" title="Speculative decoding on Intel Arc: a failed SYCL PoC and a 2x Triton fix" /><published>2026-04-14T12:00:00+00:00</published><updated>2026-04-14T12:00:00+00:00</updated><id>https://bryanvine.github.io/turboquant-xpu/2026/04/14/spec-decode-intel-arc</id><content type="html" xml:base="https://bryanvine.github.io/turboquant-xpu/2026/04/14/spec-decode-intel-arc/"><![CDATA[<h2 id="tldr">TL;DR</h2>

<ul>
  <li>TurboQuant KV cache quantization on Intel Arc Pro B70 (BMG-G31, Xe2) trades 3-8x KV capacity for 0.27-0.47x throughput vs FP16. Speculative decoding amplifies the gap: FP16+spec hits 2.37x, TQ+spec only 1.34x.</li>
  <li>I tried a custom SYCL kernel using <code class="language-plaintext highlighter-rouge">joint_matrix</code> (DPAS) for M=N_spec=8 verification. First bench: <strong>50-60x slower</strong> than Triton — per-call PCIe transfers (~400 MB/call) dominated.</li>
  <li>Rebuilt with zero-copy USM pointers. Gap closed from 50-60x to <strong>20-25x</strong>, but the remainder was algorithmic: the scalar baseline had no split-KV, no SIMD cooperation, no SLM reuse. Decision: <a href="https://github.com/bryanvine/turboquant-xpu/commit/796f7df">NO-GO (<code class="language-plaintext highlighter-rouge">796f7df</code>)</a>; thesis untested.</li>
  <li>Profiling the Triton baseline (<a href="https://github.com/bryanvine/turboquant-xpu/commit/b69399a"><code class="language-plaintext highlighter-rouge">b69399a</code></a>) revealed 24% of wall time in Level-Zero submission overhead across the N_spec loop, 6.2% FP32 compute utilization, and 3.9% BW utilization — not throughput-bound, dispatch-bound.</li>
  <li>A single fused Triton kernel (<a href="https://github.com/bryanvine/turboquant-xpu/commit/425fc5c"><code class="language-plaintext highlighter-rouge">425fc5c</code></a>, causal mode <a href="https://github.com/bryanvine/turboquant-xpu/commit/c0a69a3"><code class="language-plaintext highlighter-rouge">c0a69a3</code></a>) gives a <strong>2.04x backend-layer speedup on k3v4_nc</strong> and <strong>1.07x on k8v4</strong>. The asymmetry is the point: k8v4’s cheap FP8 dequant leaves almost nothing to share across queries; k3v4_nc’s MSE-centroid gather is expensive per tile and amortizes 8x over the spec window.</li>
  <li>Everything is in <a href="https://github.com/bryanvine/turboquant-xpu"><code class="language-plaintext highlighter-rouge">github.com/bryanvine/turboquant-xpu</code></a>. Intel’s team acknowledged TQ on XPU in <a href="https://github.com/vllm-project/vllm-xpu-kernels/issues/271">vllm-xpu-kernels issue #271</a>; a SYCL port is on their roadmap.</li>
</ul>

<h2 id="context-turboquant-speculative-decoding-and-the-gap">Context: TurboQuant, speculative decoding, and the gap</h2>

<p>TurboQuant (DeepMind, ICLR 2026; upstream <a href="https://github.com/vllm-project/vllm/pull/38479">vLLM PR #38479</a>) compresses LLM KV caches to 3-4 bits via a Walsh-Hadamard rotation plus a precomputed Lloyd-Max codebook for keys and uniform scalar quantization for values. On an Intel Arc Pro B70 (32 GB GDDR6, 32 Xe2 cores, 256 XMX engines), the three hot Triton kernels (fused store, decode stage 1, stage 2 reduction) compile cleanly via the <code class="language-plaintext highlighter-rouge">intel-xpu-backend-for-triton</code> with every correctness gate passing.</p>

<p>Capacity is excellent. At <code class="language-plaintext highlighter-rouge">max-model-len=262144</code> on Qwen3-30B-A3B, <code class="language-plaintext highlighter-rouge">turboquant_k3v4_nc</code> (3-bit MSE keys + 4-bit values + norm correction) holds <strong>549,888 KV tokens in 11.8 GiB</strong> versus ~65K for FP16 — roughly <strong>8.5x</strong>. On Gemma4-31B it’s 4.83x (10,240 to 49,408 tokens).</p>

<p>Throughput is less happy. On Qwen3-30B at C=20, TQ runs at 141.1 tok/s against FP16+EAGLE3’s 298.5 tok/s — 0.47x. That’s the steady-state cost of bit-unpacking keys and gathering centroids on every attention call, in kernels tuned for Ampere/Hopper and cross-compiled to Xe2.</p>

<p>Speculative decoding is where the picture gets awkward. FP16+suffix on Gemma4 jumps from 51.2 to 121.5 tok/s (2.37x) by verifying N_spec=8 tokens in one forward pass. TQ+suffix on the same model only goes from 27.0 to 36.3 tok/s — 1.34x. Spec helps TQ much less than FP16, and the relative slowdown widens from 0.53x to ~0.30x under spec.</p>

<p>That gap is the target. Two candidates surveyed in the <a href="https://github.com/bryanvine/turboquant-xpu/blob/main/docs/CUSTOM_KERNEL_FEASIBILITY.md">feasibility study</a>: a custom SYCL kernel using DPAS (Xe2’s 2D systolic array) with M=N_spec=8 to match the native tile shape, or a Triton restructure that fuses the N_spec=8 loop into one dispatch. The feasibility doc projected 2.5-4x from the SYCL route. This post is about trying both.</p>

<h2 id="part-1-the-sycl-attempt">Part 1: The SYCL attempt</h2>

<p>The PoC was scoped to be a go/no-go data point, not a full port. Fourteen tasks, three weeks, two variants:</p>

<ol>
  <li><strong>SYCL scalar</strong>: one work-item per <code class="language-plaintext highlighter-rouge">(n_spec, b, hq)</code>, online softmax over the sequence dimension, no matrix-unit involvement. Correctness anchor.</li>
  <li><strong>SYCL DPAS</strong>: Q·K^T tiled via <code class="language-plaintext highlighter-rouge">sycl::ext::oneapi::experimental::matrix::joint_matrix</code> using 8x16 x 16x16 fp16 tiles targeting the B70’s XMX engines. The design bet: M=N_spec=8 exactly matches the native joint_matrix tile, so the systolic array finally runs at full M-utilization during spec verification (vs M=1 for standard decode).</li>
</ol>

<p>PoC shape: N_spec=8, B=4, Hq=32, Hk=4, D=128, seqlen=8192. Same as the projected production spec-verify batch.</p>

<h3 id="toolchain-the-libsycl-abi-split">Toolchain: the libsycl ABI split</h3>

<p>Both DPAS variants required the <code class="language-plaintext highlighter-rouge">intel/llvm</code> nightly (clang 23, dated 2026-04-13). Stock oneAPI 2025.3’s <code class="language-plaintext highlighter-rouge">libsycl.so.8</code> has a <code class="language-plaintext highlighter-rouge">get_matrix_combinations()</code> table that does not list BMG-G31 — <code class="language-plaintext highlighter-rouge">joint_matrix_load</code> on a B70 throws “no matrix hardware on the target device” at runtime. The nightly ships <code class="language-plaintext highlighter-rouge">libsycl.so.9</code> with the BMG-G31 DPAS definition included.</p>

<p>The catch: the nightly’s <code class="language-plaintext highlighter-rouge">libsycl.so.9</code> requires <code class="language-plaintext highlighter-rouge">LIBUR_LOADER_0.12</code> and torch-XPU’s <code class="language-plaintext highlighter-rouge">libsycl.so.8</code> requires <code class="language-plaintext highlighter-rouge">LIBUR_LOADER_0.11</code>. Strict ABI requirements, no <code class="language-plaintext highlighter-rouge">LD_LIBRARY_PATH</code> ordering reconciles them. The workaround was a subprocess bridge: split the benchmark into two child processes with distinct <code class="language-plaintext highlighter-rouge">LD_LIBRARY_PATH</code> settings, coordinated by a JSON-passing orchestrator. Triton timings from the torch-XPU leg; SYCL timings from the nightly leg.</p>

<h3 id="correctness-passed-performance-did-not">Correctness passed. Performance did not.</h3>

<p>Every correctness gate went green: <code class="language-plaintext highlighter-rouge">joint_matrix_smoke()</code> on 8x16x16 fp16 GEMM, both presets passing <code class="language-plaintext highlighter-rouge">test_decode_spec_scalar.py</code> and <code class="language-plaintext highlighter-rouge">test_decode_spec_dpas.py</code> at small and PoC shapes. Task 13’s BLK_KV sweep identified BLK_KV=16 as the scalar-path optimum.</p>

<p>Then the go/no-go bench:</p>

<table>
  <thead>
    <tr>
      <th>preset</th>
      <th style="text-align: right">triton x N (ms)</th>
      <th style="text-align: right">SYCL scalar (ms)</th>
      <th style="text-align: right">SYCL DPAS (ms)</th>
      <th style="text-align: right">DPAS speedup</th>
    </tr>
  </thead>
  <tbody>
    <tr>
      <td>k8v4</td>
      <td style="text-align: right">10.173</td>
      <td style="text-align: right">237.686</td>
      <td style="text-align: right">613.287</td>
      <td style="text-align: right">0.02x</td>
    </tr>
    <tr>
      <td>k3v4_nc</td>
      <td style="text-align: right">13.430</td>
      <td style="text-align: right">257.912</td>
      <td style="text-align: right">600.810</td>
      <td style="text-align: right">0.02x</td>
    </tr>
  </tbody>
</table>

<p>The DPAS kernel was <strong>slower</strong> than the scalar kernel. Both were 50-60x slower than Triton. The go-criterion (DPAS speedup &gt;= 2x) was nowhere in sight.</p>

<p>The root cause was not in the kernel. The Python binding matched the numpy reference’s <code class="language-plaintext highlighter-rouge">pack_cache_for_kernel</code> layout, accepting host-side numpy arrays. Each call did <code class="language-plaintext highlighter-rouge">sycl::malloc_device</code> plus a blocking memcpy for the KV cache — <code class="language-plaintext highlighter-rouge">B * seqlen * Hk * D = 4 * 8192 * 4 * 128 = 16.8 MB</code> per buffer, and with fp32 Q, FP8 keys, norms, scales, and zeros, roughly <strong>400 MB of host-to-device transfer per call</strong>. At the B70’s PCIe 5.0 x16 bandwidth that is around 200 ms, exactly what the scalar numbers show. The kernel compute was 1-2 ms buried inside a 240 ms wall.</p>

<p>The Triton baseline, by construction, pre-allocates all XPU tensors once and loops N_spec calls each touching only device-resident buffers. Its 10-14 ms wall is true dispatch latency. I had benchmarked interface overhead against compute, not compute against compute.</p>

<h3 id="zero-copy-the-second-data-point">Zero-copy: the second data point</h3>

<p>Option A was rewriting the binding to accept <code class="language-plaintext highlighter-rouge">torch.Tensor.data_ptr()</code> USM pointers, so the SYCL kernel reads from the same device buffer Triton does. This also meant rebuilding the module against <strong>stock 2025.3 icpx</strong> (not the nightly), so the <code class="language-plaintext highlighter-rouge">.so</code> links against torch-XPU’s <code class="language-plaintext highlighter-rouge">libsycl.so.8</code> ABI — the subprocess bridge goes away for the scalar path.</p>

<p>Results after removing every byte of PCIe traffic:</p>

<table>
  <thead>
    <tr>
      <th>preset</th>
      <th style="text-align: right">triton x N (ms)</th>
      <th style="text-align: right">zc_scalar (ms)</th>
      <th style="text-align: right">zc speedup</th>
    </tr>
  </thead>
  <tbody>
    <tr>
      <td>k8v4</td>
      <td style="text-align: right">8.926</td>
      <td style="text-align: right">218.942</td>
      <td style="text-align: right">0.04x</td>
    </tr>
    <tr>
      <td>k3v4_nc</td>
      <td style="text-align: right">13.790</td>
      <td style="text-align: right">249.014</td>
      <td style="text-align: right">0.06x</td>
    </tr>
  </tbody>
</table>

<p>The 50-60x gap closed to 20-25x. Still nowhere near the required &gt;=0.5x. Removing data transfer revealed a structural gap in the kernel itself. Inspecting <code class="language-plaintext highlighter-rouge">sycl/zc/src/tq_decode_spec_zc.cpp</code> against the Triton kernel spells out what’s missing:</p>

<ol>
  <li><strong>No split-KV.</strong> Triton uses <code class="language-plaintext highlighter-rouge">NUM_KV_SPLITS=32</code> to partition seqlen across parallel WGs plus a stage-2 log-sum-exp reduction. The SYCL scalar kernel assigns one work-item per <code class="language-plaintext highlighter-rouge">(n_spec, b, hq)</code> and iterates serially over all 8192 positions — ~1024 work-items each doing 8192 sequential FMAs, a long critical path rather than a tree.</li>
  <li><strong>No SIMD / sub-group cooperation.</strong> Each work-item issues scalar FMAs. Xe2’s SIMD16 units have 16 lanes waiting for work the kernel never lets them do.</li>
  <li><strong>No SLM reuse across queries.</strong> Each work-item loads K and V independently from HBM; multiple work-items sharing the same KV head all re-read and re-dequant the same key vectors.</li>
  <li><strong>No prefetch, no online-softmax pipelining.</strong> Triton uses <code class="language-plaintext highlighter-rouge">tl.dot</code> with async-load hints and an online softmax tuned for the Xe2 memory hierarchy. The scalar SYCL is a straight textbook online softmax.</li>
</ol>

<p>The PoC ran a DPAS proof against a scalar baseline that was algorithmically uncompetitive with Triton. Showing DPAS beats a bad SYCL scalar would prove nothing about whether DPAS beats Triton.</p>

<h3 id="honest-verdict-no-go-thesis-untested">Honest verdict: NO-GO, thesis untested</h3>

<p>The feasibility doc’s 2.5-4x projection assumed a <strong>production-grade SYCL baseline</strong>: split-KV parallelism, SIMD16 vectorization over D, SLM-staged K dequant shared across the KV group, and only then DPAS on top for the matrix contractions. The PoC built the DPAS contribution in isolation. The data doesn’t prove the thesis, and it doesn’t disprove it either — it measures a kernel missing the structural work the feasibility doc itself called prerequisite. The only honest path to test the 2.5-4x claim is a production-grade SYCL re-implementation — a 4-5 month commitment that should not start until the libsycl ABI split is resolved upstream.</p>

<p>The PoC did produce concrete deliverables: a working CMake + pybind11 + SYCL build recipe for BMG-G31, environment notes for the SO-version gotchas, 14 passing correctness tests, a subprocess-bridge harness, and confirmation that joint_matrix is accessible on B70 given the right toolchain. Merged to main as <a href="https://github.com/bryanvine/turboquant-xpu/commit/796f7df"><code class="language-plaintext highlighter-rouge">796f7df</code></a> with a NO-GO flag and a pointer forward.</p>

<h2 id="part-2-profiling-the-actual-triton-baseline">Part 2: Profiling the actual Triton baseline</h2>

<p>The next question was obvious: is Triton actually fast, or just fast relative to our bad SYCL? If the real bottleneck is something a Triton tweak could fix, the 14-task SYCL bet was the wrong tool.</p>

<p>VTune was the plan. VTune 2025.10 reports <code class="language-plaintext highlighter-rouge">"This analysis type is not applicable to the system because VTune Profiler cannot recognize the processor"</code> when you point <code class="language-plaintext highlighter-rouge">gpu-hotspots</code>, <code class="language-plaintext highlighter-rouge">gpu-offload</code>, or <code class="language-plaintext highlighter-rouge">xpu-offload</code> at the B70 — BMG-G31 is too new for the 2025.10 PMU database. Fell back to <code class="language-plaintext highlighter-rouge">torch.profiler</code> with <code class="language-plaintext highlighter-rouge">ProfilerActivity.XPU</code> (PTI-backed via <code class="language-plaintext highlighter-rouge">libpti_view.so</code>), wall-clock timing with and without <code class="language-plaintext highlighter-rouge">xpu.synchronize()</code>, and roofline math against the B70’s 608 GB/s HBM peak and 8 TFLOPS FP32 peak.</p>

<p>At the PoC shape (N_spec=8, k8v4, seqlen=8192):</p>

<table>
  <thead>
    <tr>
      <th>Metric</th>
      <th>Value</th>
    </tr>
  </thead>
  <tbody>
    <tr>
      <td>Wall time, N_spec=8 loop (synced)</td>
      <td>8.922 ms</td>
    </tr>
    <tr>
      <td>GPU time, <code class="language-plaintext highlighter-rouge">_tq_decode_stage1</code> (per call)</td>
      <td>1,087 us</td>
    </tr>
    <tr>
      <td>GPU time, <code class="language-plaintext highlighter-rouge">_fwd_kernel_stage2</code> (per call)</td>
      <td>5.9 us</td>
    </tr>
    <tr>
      <td>CPU dispatch (no-sync, full loop)</td>
      <td>2.100 ms</td>
    </tr>
    <tr>
      <td>Per-launch CPU overhead</td>
      <td>262 us</td>
    </tr>
    <tr>
      <td><code class="language-plaintext highlighter-rouge">urEnqueueKernelLaunch</code> per call</td>
      <td>87 us</td>
    </tr>
  </tbody>
</table>

<p>Each call to the decode op dispatches 2 kernels (stage1 + stage2), so the N_spec=8 loop is 16 Level-Zero submissions. Stage 2 takes &lt;1% of GPU time — it’s not on the hot path.</p>

<h3 id="roofline">Roofline</h3>

<p>KV cache read per stage 1 call with <code class="language-plaintext highlighter-rouge">slot_size_aligned=196</code>:</p>

<div class="language-plaintext highlighter-rouge"><div class="highlight"><pre class="highlight"><code>2048 blocks * 16 tokens * 4 Hk * 196 bytes = 25.7 MB
</code></pre></div></div>

<p>At 1,087 us that’s <strong>23.6 GB/s — 3.9% of 608 GB/s</strong>. Nowhere near bandwidth-bound.</p>

<p>Stage 1 FLOPs (QK + AV matmuls):</p>

<div class="language-plaintext highlighter-rouge"><div class="highlight"><pre class="highlight"><code>2 * B * Hq * seqlen * D * 2 = 0.54 GFLOP
</code></pre></div></div>

<p>At 1,087 us that’s <strong>0.49 TFLOPS — 6.2% of 8 TFLOPS FP32</strong>. Nowhere near compute-bound either.</p>

<p>Arithmetic intensity is 20.9 FLOP/byte against a ridge point of 13.2 FLOP/byte — nominally compute-side of the roofline, but 6.2% of peak is not a compute-bound workload in any useful sense. It is an EU-underoccupancy workload that happens to sit above the ridge line. The real question is why EUs are idle, not whether arithmetic density is high enough.</p>

<h3 id="the-24-dispatch-tax">The 24% dispatch tax</h3>

<p>Breaking out the 8.922 ms N_spec loop:</p>

<table>
  <thead>
    <tr>
      <th>Source</th>
      <th style="text-align: right">Cost</th>
      <th style="text-align: right">% of wall</th>
    </tr>
  </thead>
  <tbody>
    <tr>
      <td><code class="language-plaintext highlighter-rouge">urEnqueueKernelLaunch</code> (16 calls x 87 us)</td>
      <td style="text-align: right">1.39 ms</td>
      <td style="text-align: right">16%</td>
    </tr>
    <tr>
      <td>Python call overhead (16 x 175 us)</td>
      <td style="text-align: right">2.80 ms</td>
      <td style="text-align: right">31%</td>
    </tr>
    <tr>
      <td><strong>Total CPU dispatch</strong></td>
      <td style="text-align: right"><strong>2.10 ms</strong></td>
      <td style="text-align: right"><strong>24%</strong></td>
    </tr>
  </tbody>
</table>

<p>CPU dispatch and GPU execution overlap (the driver pipelines ahead), so these don’t sum naively. The aggregate is that ~24% of wall time is Level-Zero submission and Python glue around 16 launches — a fixed per-dispatch cost that no kernel-level change can reduce because it exists outside the kernel.</p>

<p>Classification: <strong>compute-underutilized / serialized-dispatch</strong>. Two structural wins are visible:</p>

<ol>
  <li><strong>Eliminate most of the launches.</strong> Sixteen dispatches could become two (one stage 1, one stage 2 for all N_spec). Hard lower bound: ~1.22 ms saved (14 x 87 us).</li>
  <li><strong>Share per-tile work across queries.</strong> All N_spec=8 queries attend to the same KV cache; loading and dequanting each K tile once instead of once per query amortizes the bit-unpack and centroid gather 8x.</li>
</ol>

<p>Neither needs SYCL. Both are single-file changes to the Triton kernel. Commit <a href="https://github.com/bryanvine/turboquant-xpu/commit/b69399a"><code class="language-plaintext highlighter-rouge">b69399a</code></a> for the profile artefacts.</p>

<h2 id="part-3-the-fused-triton-kernel">Part 3: The fused Triton kernel</h2>

<p><code class="language-plaintext highlighter-rouge">_tq_decode_stage1_spec</code> takes <code class="language-plaintext highlighter-rouge">Q</code> of shape <code class="language-plaintext highlighter-rouge">[N_spec, B, Hq, D]</code> and processes all queries in a single dispatch. The grid stays <code class="language-plaintext highlighter-rouge">(B, Hq, NUM_KV_SPLITS)</code> — N_spec is handled by a loop inside each work-group, sharing the K dequant per BLOCK_KV tile across queries that live together in registers.</p>

<p>The load-bearing structure is about this:</p>

<div class="language-python highlighter-rouge"><div class="highlight"><pre class="highlight"><code><span class="nd">@triton.jit</span>
<span class="k">def</span> <span class="nf">_tq_decode_stage1_spec</span><span class="p">(</span><span class="n">Q_rot_ptr</span><span class="p">,</span> <span class="n">KV_cache_ptr</span><span class="p">,</span> <span class="p">...,</span> <span class="n">N_SPEC</span><span class="p">:</span> <span class="n">tl</span><span class="p">.</span><span class="n">constexpr</span><span class="p">):</span>
    <span class="n">bid</span> <span class="o">=</span> <span class="n">tl</span><span class="p">.</span><span class="nf">program_id</span><span class="p">(</span><span class="mi">0</span><span class="p">);</span> <span class="n">hid</span> <span class="o">=</span> <span class="n">tl</span><span class="p">.</span><span class="nf">program_id</span><span class="p">(</span><span class="mi">1</span><span class="p">);</span> <span class="n">sid</span> <span class="o">=</span> <span class="n">tl</span><span class="p">.</span><span class="nf">program_id</span><span class="p">(</span><span class="mi">2</span><span class="p">)</span>
    <span class="n">n_idx</span> <span class="o">=</span> <span class="n">tl</span><span class="p">.</span><span class="nf">arange</span><span class="p">(</span><span class="mi">0</span><span class="p">,</span> <span class="n">N_SPEC</span><span class="p">)</span>                     <span class="c1"># [N_SPEC]
</span>
    <span class="c1"># Load all N_spec queries for this (b, h) once, stay in registers:
</span>    <span class="n">q_all</span> <span class="o">=</span> <span class="n">tl</span><span class="p">.</span><span class="nf">load</span><span class="p">(</span><span class="n">Q_rot_ptr</span> <span class="o">+</span> <span class="n">n_idx</span><span class="p">[:,</span> <span class="bp">None</span><span class="p">]</span> <span class="o">*</span> <span class="n">stride_q_nspec</span>
                    <span class="o">+</span> <span class="n">bid</span> <span class="o">*</span> <span class="n">stride_qb</span> <span class="o">+</span> <span class="n">hid</span> <span class="o">*</span> <span class="n">stride_qh</span>
                    <span class="o">+</span> <span class="n">d_offs</span><span class="p">[</span><span class="bp">None</span><span class="p">,</span> <span class="p">:],</span> <span class="p">...)</span>          <span class="c1"># [N_SPEC, D]
</span>
    <span class="n">m_prev</span> <span class="o">=</span> <span class="n">tl</span><span class="p">.</span><span class="nf">full</span><span class="p">([</span><span class="n">N_SPEC</span><span class="p">],</span> <span class="o">-</span><span class="nf">float</span><span class="p">(</span><span class="sh">"</span><span class="s">inf</span><span class="sh">"</span><span class="p">),</span> <span class="n">tl</span><span class="p">.</span><span class="n">float32</span><span class="p">)</span>
    <span class="n">l_prev</span> <span class="o">=</span> <span class="n">tl</span><span class="p">.</span><span class="nf">zeros</span><span class="p">([</span><span class="n">N_SPEC</span><span class="p">],</span> <span class="n">tl</span><span class="p">.</span><span class="n">float32</span><span class="p">)</span>
    <span class="n">acc</span>    <span class="o">=</span> <span class="n">tl</span><span class="p">.</span><span class="nf">zeros</span><span class="p">([</span><span class="n">N_SPEC</span><span class="p">,</span> <span class="n">BLOCK_D</span><span class="p">],</span> <span class="n">tl</span><span class="p">.</span><span class="n">float32</span><span class="p">)</span>

    <span class="k">for</span> <span class="n">start_n</span> <span class="ow">in</span> <span class="nf">range</span><span class="p">(</span><span class="n">split_start</span><span class="p">,</span> <span class="n">split_end</span><span class="p">,</span> <span class="n">BLOCK_KV</span><span class="p">):</span>
        <span class="c1"># ONE K dequant per tile, shared across all N_SPEC queries:
</span>        <span class="n">k_tile</span> <span class="o">=</span> <span class="o">&lt;</span><span class="n">bit</span><span class="o">-</span><span class="n">unpack</span> <span class="o">+</span> <span class="n">centroid</span> <span class="n">gather</span> <span class="o">+</span> <span class="n">norm</span> <span class="n">correction</span><span class="o">&gt;</span>  <span class="c1"># [BLOCK_KV, D]
</span>
        <span class="c1"># [N_SPEC, BLOCK_KV] = [N_SPEC, D] x [BLOCK_KV, D]^T:
</span>        <span class="n">scores</span> <span class="o">=</span> <span class="n">tl</span><span class="p">.</span><span class="nf">sum</span><span class="p">(</span><span class="n">q_all</span><span class="p">[:,</span> <span class="bp">None</span><span class="p">,</span> <span class="p">:]</span> <span class="o">*</span> <span class="n">k_tile</span><span class="p">[</span><span class="bp">None</span><span class="p">,</span> <span class="p">:,</span> <span class="p">:],</span> <span class="n">axis</span><span class="o">=</span><span class="mi">2</span><span class="p">)</span> <span class="o">*</span> <span class="n">ATTN_SCALE</span>

        <span class="c1"># Per-query online softmax, vectorized over N_SPEC:
</span>        <span class="n">m_new</span> <span class="o">=</span> <span class="n">tl</span><span class="p">.</span><span class="nf">maximum</span><span class="p">(</span><span class="n">m_prev</span><span class="p">,</span> <span class="n">tl</span><span class="p">.</span><span class="nf">max</span><span class="p">(</span><span class="n">scores</span><span class="p">,</span> <span class="n">axis</span><span class="o">=</span><span class="mi">1</span><span class="p">))</span>
        <span class="bp">...</span>
</code></pre></div></div>

<p>The <code class="language-plaintext highlighter-rouge">q_all[:, None, :] * k_tile[None, :, :]</code> broadcast sum is the load-bearing piece. It expresses the M=N_spec GEMM without any DPAS-specific intrinsic, but it gives the Triton-on-Xe2 compiler an 8-wide contraction it can schedule against SIMD16 lanes more naturally than 8 separate 1-wide contractions in a Python loop. The same pattern repeats for P·V, with online-softmax state vectorized over <code class="language-plaintext highlighter-rouge">N_SPEC</code>: <code class="language-plaintext highlighter-rouge">m_prev [N_SPEC]</code>, <code class="language-plaintext highlighter-rouge">l_prev [N_SPEC]</code>, <code class="language-plaintext highlighter-rouge">acc [N_SPEC, BLOCK_D]</code>, all in registers.</p>

<h3 id="micro-bench-commit-425fc5c">Micro-bench (commit <code class="language-plaintext highlighter-rouge">425fc5c</code>)</h3>

<p>PoC shape, same-seq_len-per-query baseline (parallel-completion semantics):</p>

<table>
  <thead>
    <tr>
      <th>Preset</th>
      <th style="text-align: right">looped (ms)</th>
      <th style="text-align: right">fused (ms)</th>
      <th style="text-align: right">speedup</th>
    </tr>
  </thead>
  <tbody>
    <tr>
      <td>turboquant_k8v4</td>
      <td style="text-align: right">8.955</td>
      <td style="text-align: right">3.305</td>
      <td style="text-align: right"><strong>2.71x</strong></td>
    </tr>
    <tr>
      <td>turboquant_k3v4_nc</td>
      <td style="text-align: right">16.005</td>
      <td style="text-align: right">3.795</td>
      <td style="text-align: right"><strong>4.22x</strong></td>
    </tr>
  </tbody>
</table>

<p>Clears the projected 35-55% reduction by a wide margin. Commit <a href="https://github.com/bryanvine/turboquant-xpu/commit/425fc5c"><code class="language-plaintext highlighter-rouge">425fc5c</code></a>.</p>

<h3 id="post-fusion-profile-d6b6afb">Post-fusion profile (<code class="language-plaintext highlighter-rouge">d6b6afb</code>)</h3>

<p>Running the same profiling script against the fused kernel:</p>

<table>
  <thead>
    <tr>
      <th>Metric</th>
      <th style="text-align: right">k8v4 un-fused</th>
      <th style="text-align: right">k8v4 fused</th>
      <th style="text-align: right">k3v4_nc fused</th>
    </tr>
  </thead>
  <tbody>
    <tr>
      <td>Wall time (mean ms)</td>
      <td style="text-align: right">8.922</td>
      <td style="text-align: right">3.029</td>
      <td style="text-align: right">3.815</td>
    </tr>
    <tr>
      <td>CPU dispatch (ms)</td>
      <td style="text-align: right">2.100</td>
      <td style="text-align: right">0.204</td>
      <td style="text-align: right">0.378</td>
    </tr>
    <tr>
      <td>CPU dispatch (% wall)</td>
      <td style="text-align: right">23.5%</td>
      <td style="text-align: right">6.7%</td>
      <td style="text-align: right">9.9%</td>
    </tr>
    <tr>
      <td>LZ dispatches per outer iter</td>
      <td style="text-align: right">16</td>
      <td style="text-align: right">2</td>
      <td style="text-align: right">2</td>
    </tr>
    <tr>
      <td>Compute util (FP32)</td>
      <td style="text-align: right">6.2%</td>
      <td style="text-align: right"><strong>17.7%</strong></td>
      <td style="text-align: right"><strong>14.1%</strong></td>
    </tr>
    <tr>
      <td>Arithmetic intensity (F/B)</td>
      <td style="text-align: right">20.9</td>
      <td style="text-align: right">167.2</td>
      <td style="text-align: right">273.1</td>
    </tr>
  </tbody>
</table>

<p>Launch overhead fell from 2.10 ms to 0.20 ms — from 24% of wall time to under 10%. Compute utilization roughly tripled to 14-18% (bandwidth utilization <em>fell</em>, because per-tile K data is now read once and reused instead of reloaded per query — arithmetic intensity jumps accordingly).</p>

<p>Attribution: of the ~5.9 ms k8v4 wall-time reduction, about 1.9 ms (62%) is direct launch-overhead elimination; the remaining ~40% comes from K-dequant sharing across the N_spec window. The per-preset asymmetry this sharing produces matters more at the integration layer — covered in Part 6.</p>

<h2 id="part-4-the-causal-correction">Part 4: The causal correction</h2>

<p>With the fused numbers on hand, I posted them to the <a href="https://github.com/vllm-project/vllm-xpu-kernels/issues/271">vllm-xpu-kernels issue #271</a> thread (Intel’s SYCL team was following). Then I read the integration site more carefully and realized the micro-bench was wrong.</p>

<p>In <code class="language-plaintext highlighter-rouge">_prefill_attention</code>, the spec-verify continuation path doesn’t use a single uniform <code class="language-plaintext highlighter-rouge">seq_len</code> for all N_spec queries. It synthesizes per-query lengths with <code class="language-plaintext highlighter-rouge">synth_seq_lens = torch.arange(cached_len + 1, seq_len + 1)</code>. Query <code class="language-plaintext highlighter-rouge">n</code> attends to <code class="language-plaintext highlighter-rouge">cached_len + n + 1</code> tokens — the whole point of causal verification is scoring <code class="language-plaintext highlighter-rouge">P(token_{n+1} | token_{0..n}, cache)</code> for each <code class="language-plaintext highlighter-rouge">n</code>, not <code class="language-plaintext highlighter-rouge">P(token_{n+1} | token_{0..N_spec}, cache)</code>. The “parallel completion” semantics the micro-bench used — all queries sharing one seq_len — would leak future candidate tokens into earlier queries’ attention.</p>

<p>My kernel was semantically wrong for spec-verify. The numbers were real but measuring the wrong thing.</p>

<h3 id="the-fix-commit-c0a69a3">The fix (commit <code class="language-plaintext highlighter-rouge">c0a69a3</code>)</h3>

<p>Added a <code class="language-plaintext highlighter-rouge">CAUSAL: tl.constexpr</code> mode and a scalar <code class="language-plaintext highlighter-rouge">cached_len: tl.constexpr</code>. When <code class="language-plaintext highlighter-rouge">CAUSAL=1</code>, compute per-query effective end positions once and mask inside the hot loop:</p>

<div class="language-python highlighter-rouge"><div class="highlight"><pre class="highlight"><code><span class="k">if</span> <span class="n">CAUSAL</span><span class="p">:</span>
    <span class="n">eff_end_per_query</span> <span class="o">=</span> <span class="n">tl</span><span class="p">.</span><span class="nf">minimum</span><span class="p">(</span><span class="n">cached_len</span> <span class="o">+</span> <span class="n">n_idx</span> <span class="o">+</span> <span class="mi">1</span><span class="p">,</span> <span class="n">seq_len</span><span class="p">)</span>  <span class="c1"># [N_SPEC]
</span>
<span class="c1"># ...inside the hot loop, after scoring:
</span><span class="k">if</span> <span class="n">CAUSAL</span><span class="p">:</span>
    <span class="n">causal_mask</span> <span class="o">=</span> <span class="n">kv_mask</span><span class="p">[</span><span class="bp">None</span><span class="p">,</span> <span class="p">:]</span> <span class="o">&amp;</span> <span class="p">(</span><span class="n">kv_offs</span><span class="p">[</span><span class="bp">None</span><span class="p">,</span> <span class="p">:]</span> <span class="o">&lt;</span> <span class="n">eff_end_per_query</span><span class="p">[:,</span> <span class="bp">None</span><span class="p">])</span>
    <span class="n">scores</span> <span class="o">=</span> <span class="n">tl</span><span class="p">.</span><span class="nf">where</span><span class="p">(</span><span class="n">causal_mask</span><span class="p">,</span> <span class="n">scores</span><span class="p">,</span> <span class="o">-</span><span class="nf">float</span><span class="p">(</span><span class="sh">"</span><span class="s">inf</span><span class="sh">"</span><span class="p">))</span>
</code></pre></div></div>

<p><code class="language-plaintext highlighter-rouge">CAUSAL=0</code> stays byte-identical to the original kernel, so the parallel-completion path is preserved. About 6 hours of work including new tests. Causal-mode micro-bench:</p>

<table>
  <thead>
    <tr>
      <th>preset</th>
      <th style="text-align: right">looped causal (ms)</th>
      <th style="text-align: right">fused causal (ms)</th>
      <th style="text-align: right">causal speedup</th>
    </tr>
  </thead>
  <tbody>
    <tr>
      <td>turboquant_k8v4</td>
      <td style="text-align: right">8.989</td>
      <td style="text-align: right">3.523</td>
      <td style="text-align: right"><strong>2.55x</strong></td>
    </tr>
    <tr>
      <td>turboquant_k3v4_nc</td>
      <td style="text-align: right">14.088</td>
      <td style="text-align: right">4.851</td>
      <td style="text-align: right"><strong>2.90x</strong></td>
    </tr>
  </tbody>
</table>

<p>Slightly below parallel-completion (2.71x / 4.22x), because the per-query mask adds a broadcast comparison and <code class="language-plaintext highlighter-rouge">tl.where</code> inside the hot loop, and because the looped causal baseline does marginally less work on average (earlier queries have shorter context). Still comfortably above the 1.3x threshold I had mentally set for “fusion worth the code.”</p>

<p>Posted a correction to the GH issue. Being upfront about your own mistakes matters more than being right first; Intel was going to look at the code eventually and better for them to see corrected numbers from me than find the bug themselves. Commit <a href="https://github.com/bryanvine/turboquant-xpu/commit/c0a69a3"><code class="language-plaintext highlighter-rouge">c0a69a3</code></a>; test <code class="language-plaintext highlighter-rouge">tests/test_fused_nspec.py::test_fused_causal_matches_looped</code>.</p>

<h2 id="part-5-autotune-and-the-register-wall">Part 5: Autotune and the register wall</h2>

<p>The post-fusion profile suggested projected gains from three knobs: BLOCK_KV 4 -&gt; 16/32 (1.5-2.5x from more instruction-level parallelism), num_warps 1 -&gt; 2/4 (1.2-1.5x from hardware thread interleaving), and NUM_KV_SPLITS 32 -&gt; 8/16 (1.1-1.3x from per-split cache reuse).</p>

<p>A 144-config sweep (BLOCK_KV ∈ {4, 8, 16, 32}, num_warps ∈ {1, 2, 4}, NUM_KV_SPLITS ∈ {8, 16, 32}, across two presets and two causal modes) ran cleanly — zero skips, zero compiler spill errors. Winners:</p>

<table>
  <thead>
    <tr>
      <th>mode</th>
      <th>preset</th>
      <th style="text-align: right">BLOCK_KV</th>
      <th style="text-align: right">num_warps</th>
      <th style="text-align: right">NUM_KV_SPLITS</th>
      <th style="text-align: right">ms/call</th>
    </tr>
  </thead>
  <tbody>
    <tr>
      <td>parallel</td>
      <td>k8v4</td>
      <td style="text-align: right">4</td>
      <td style="text-align: right">1</td>
      <td style="text-align: right">32</td>
      <td style="text-align: right">3.041</td>
    </tr>
    <tr>
      <td>parallel</td>
      <td>k3v4_nc</td>
      <td style="text-align: right">4</td>
      <td style="text-align: right">1</td>
      <td style="text-align: right">32</td>
      <td style="text-align: right">3.799</td>
    </tr>
    <tr>
      <td>causal</td>
      <td>k8v4</td>
      <td style="text-align: right">4</td>
      <td style="text-align: right">1</td>
      <td style="text-align: right">8</td>
      <td style="text-align: right">3.204</td>
    </tr>
    <tr>
      <td>causal</td>
      <td>k3v4_nc</td>
      <td style="text-align: right">4</td>
      <td style="text-align: right">1</td>
      <td style="text-align: right">32</td>
      <td style="text-align: right">4.749</td>
    </tr>
  </tbody>
</table>

<p>BLOCK_KV=4 and num_warps=1 won every category. The projected 1.5-2.5x from larger tiles was nowhere. Only meaningful win from the whole sweep: NUM_KV_SPLITS=8 for k8v4 causal (+0.20x, because splits=32 over-spreads at this shape).</p>

<p>The explanation is register budget. The kernel carries <code class="language-plaintext highlighter-rouge">q_all[8, 128]</code> (4 KB fp32), <code class="language-plaintext highlighter-rouge">acc[8, 128]</code> (4 KB), and <code class="language-plaintext highlighter-rouge">scores[8, BLOCK_KV]</code> (512 B at BLOCK_KV=4) in registers — about 8.5 KB of per-thread live state. Xe2’s register file is 64 KB per XVE with 8 hardware threads at full occupancy, giving each thread ~8 KB of effective budget. BLOCK_KV=4 is already at the edge. Doubling to 8 pushes <code class="language-plaintext highlighter-rouge">scores</code> to 1 KB; total goes to ~9.5 KB and starts spilling to scratch — throughput collapses even though the compiler reports no error. num_warps &gt; 1 splits the thread budget further with the same effect.</p>

<p>Lesson: <strong>projected multiplicative wins from unrelated knobs do not compound when one dimension is register-budget-capped.</strong> The sweep can only find what the hardware allows.</p>

<p>Commit <a href="https://github.com/bryanvine/turboquant-xpu/commit/8b4291f"><code class="language-plaintext highlighter-rouge">8b4291f</code></a>, full numbers in <code class="language-plaintext highlighter-rouge">docs/tuning/fused_nspec_sweep_2026-04-14.txt</code>. Launcher reads env-var overrides for future A/B testing.</p>

<h2 id="part-6-backend-integration--the-real-number">Part 6: Backend integration — the real number</h2>

<p>Integrating into <code class="language-plaintext highlighter-rouge">_prefill_attention</code> is a small Python patch. <code class="language-plaintext highlighter-rouge">TurboQuantAttentionImpl.forward</code> branches on <code class="language-plaintext highlighter-rouge">attn_metadata.is_prefill</code>, which is true whenever <code class="language-plaintext highlighter-rouge">max_query_len &gt; 1</code>. During spec-verify the scheduler sends <code class="language-plaintext highlighter-rouge">query_lens == N_spec</code>, so <code class="language-plaintext highlighter-rouge">is_prefill=True</code> and spec-verify routes to <code class="language-plaintext highlighter-rouge">_prefill_attention</code>. A continuation-chunk branch there handles <code class="language-plaintext highlighter-rouge">q_len &lt;= _CONTINUATION_DECODE_THRESHOLD</code> (128) by calling <code class="language-plaintext highlighter-rouge">triton_turboquant_decode_attention</code> in a Python loop with <code class="language-plaintext highlighter-rouge">synth_seq_lens = arange(cached_len+1, seq_len+1)</code>. That’s the looped path.</p>

<p>The integration patch (commit <a href="https://github.com/bryanvine/turboquant-xpu/commit/9974d8e"><code class="language-plaintext highlighter-rouge">9974d8e</code></a>) adds a gate in that branch:</p>

<div class="language-python highlighter-rouge"><div class="highlight"><pre class="highlight"><code><span class="n">use_fused</span> <span class="o">=</span> <span class="p">(</span>
    <span class="n">_USE_FUSED_SPEC</span>
    <span class="ow">and</span> <span class="n">_FUSED_SPEC_AVAILABLE</span>
    <span class="ow">and</span> <span class="mi">1</span> <span class="o">&lt;</span> <span class="n">q_len</span> <span class="o">&lt;=</span> <span class="n">_FUSED_SPEC_MAX_QLEN</span>  <span class="c1"># &lt;= 8
</span><span class="p">)</span>
<span class="k">if</span> <span class="n">use_fused</span><span class="p">:</span>
    <span class="n">q_spec</span> <span class="o">=</span> <span class="n">q_seq</span><span class="p">.</span><span class="nf">unsqueeze</span><span class="p">(</span><span class="mi">1</span><span class="p">)</span>              <span class="c1"># (q_len, Hq, D) -&gt; (N_spec, B=1, Hq, D)
</span>    <span class="n">sl_single</span> <span class="o">=</span> <span class="n">torch</span><span class="p">.</span><span class="nf">tensor</span><span class="p">([</span><span class="n">seq_len</span><span class="p">],</span> <span class="p">...)</span>
    <span class="n">out_spec</span> <span class="o">=</span> <span class="nf">_decode_attention_spec_fused</span><span class="p">(</span>
        <span class="n">query</span><span class="o">=</span><span class="n">q_spec</span><span class="p">,</span> <span class="n">kv_cache</span><span class="o">=</span><span class="n">kv_cache</span><span class="p">,</span> <span class="p">...,</span>
        <span class="n">causal</span><span class="o">=</span><span class="bp">True</span><span class="p">,</span> <span class="n">cached_len</span><span class="o">=</span><span class="n">cached_len</span><span class="p">,</span>
    <span class="p">)</span>
    <span class="n">out</span> <span class="o">=</span> <span class="n">out_spec</span><span class="p">.</span><span class="nf">squeeze</span><span class="p">(</span><span class="mi">1</span><span class="p">)</span>                <span class="c1"># -&gt; (q_len, Hq, D)
</span><span class="k">else</span><span class="p">:</span>
    <span class="c1"># existing looped path, unchanged
</span>    <span class="bp">...</span>
</code></pre></div></div>

<p>Gated behind <code class="language-plaintext highlighter-rouge">TQ_USE_FUSED_SPEC</code> so users can A/B per preset. The looped path below the <code class="language-plaintext highlighter-rouge">else:</code> is preserved exactly, so q_len==1 (pure decode) and q_len&gt;8 (outside the fused range — register pressure at N_spec=16 is ~16 KB, past the B70 wall) cannot regress. A new test (<code class="language-plaintext highlighter-rouge">test_turboquant_attn_fused_path.py</code>) calls both paths with identical inputs and asserts <code class="language-plaintext highlighter-rouge">torch.testing.assert_close(atol=5e-3, rtol=1e-2)</code> — both presets pass with NaN parity.</p>

<h3 id="the-backend-layer-bench">The backend-layer bench</h3>

<p><code class="language-plaintext highlighter-rouge">bench_backend_integration.py</code> times the looped path against the fused path with realistic inputs — single request, q_len=N_spec=8, with the looped path passing the real <code class="language-plaintext highlighter-rouge">synth_seq_lens</code> that <code class="language-plaintext highlighter-rouge">_prefill_attention</code> actually builds. Warmup 5, N_timed 20 per measurement:</p>

<table>
  <thead>
    <tr>
      <th>preset</th>
      <th style="text-align: right">looped (ms)</th>
      <th style="text-align: right">fused (ms)</th>
      <th style="text-align: right">speedup</th>
    </tr>
  </thead>
  <tbody>
    <tr>
      <td>turboquant_k8v4</td>
      <td style="text-align: right">3.140</td>
      <td style="text-align: right">2.934</td>
      <td style="text-align: right"><strong>1.07x</strong></td>
    </tr>
    <tr>
      <td>turboquant_k3v4_nc</td>
      <td style="text-align: right">3.992</td>
      <td style="text-align: right">1.955</td>
      <td style="text-align: right"><strong>2.04x</strong></td>
    </tr>
  </tbody>
</table>

<p>These are substantially smaller than the kernel-alone causal micro-bench (2.75x / 2.99x). The reason: the production baseline isn’t 8 separate kernel calls. <code class="language-plaintext highlighter-rouge">_prefill_attention</code> makes <strong>one call with B=N_spec=8 and incrementing seq_lens</strong>, delegating the per-spec-token dimension to the batch axis of the existing single-query kernel. That already pays the dispatch cost once and exploits cross-query batch parallelism — so the launch-overhead elimination that drove ~60% of the micro-bench speedup doesn’t exist at the integration layer.</p>

<p>What remains is K-dequant sharing. For <code class="language-plaintext highlighter-rouge">k3v4_nc</code> (MSE-centroid rotation + norm correction per tile — expensive) sharing across 8 queries is worth 2.04x. For <code class="language-plaintext highlighter-rouge">k8v4</code> (a single FP8 bitcast per tile — cheap) there’s almost nothing to share, so the fused kernel barely beats the batched looped kernel: 1.07x.</p>

<p>Enabling fusion is worth 2x for <code class="language-plaintext highlighter-rouge">k3v4_nc</code> — also the preset that matters most, giving 3.7-8.5x KV capacity depending on model. <code class="language-plaintext highlighter-rouge">k8v4</code> is effectively neutral.</p>

<h3 id="what-isnt-measured">What isn’t measured</h3>

<p>End-to-end server-layer tokens/sec is not in this post. The running vllm-xpu container currently serves Gemma4-31B GPTQ with FP16 KV cache, not a TurboQuant model — the docker-compose file only mounts the GPTQ XPU regression patch, not the TurboQuant backend files. A full offline engine bench requires a TQ-compatible GPTQ checkpoint on disk plus a compose update and model reload with <code class="language-plaintext highlighter-rouge">--kv-cache-dtype turboquant_k3v4_nc</code>. Blocked on checkpoint availability. The backend-layer 2.04x is the honest measurement that’s available today.</p>

<h2 id="part-7-working-with-intel">Part 7: Working with Intel</h2>

<p>Opened <a href="https://github.com/vllm-project/vllm-xpu-kernels/issues/271">issue #271</a> on <code class="language-plaintext highlighter-rouge">vllm-project/vllm-xpu-kernels</code> with the feasibility report: TurboQuant works on XPU via the upstream Triton path, here are the benchmarks, here is what we think is leaving performance on the table, here is a proposed SYCL optimization plan. Intel’s <code class="language-plaintext highlighter-rouge">yma11</code> replied acknowledging TQ on XPU and stating that a SYCL port is on their roadmap (no timeline).</p>

<p>Five follow-up comments over the two weeks: the torch.profiler / PTI profile data with the 24% dispatch breakdown, the parallel-completion micro-bench (4.22x), the causal-mode correction (2.90x), and the final backend-layer numbers (2.04x / 1.07x). Intel has the data if they want it.</p>

<p>The work stayed in our repo rather than going upstream as a PR. The fused-N_spec Triton kernel is complementary to Intel’s future SYCL port, not competing with it — Intel’s SYCL work will eventually replace the Triton decode path on XPU, at which point the fused Triton kernel becomes a bridge rather than a destination. Kept the PR offer open but didn’t block on acceptance.</p>

<h2 id="part-8-lessons">Part 8: Lessons</h2>

<p><strong>Profile before porting.</strong> The PoC committed 14 tasks to a custom SYCL kernel when a simpler Triton restructure would have done the job. The 6.2% compute utilization and 24% launch overhead from the first profile would have pointed straight at fusion. The order of operations in this post — SYCL first, profile second — is the order I did it in, not the order I would do it in again.</p>

<p><strong>Validate the baseline you’re beating.</strong> The first micro-bench compared against a same-seq_len-per-query baseline. That’s correct for scoring N alternative completions against the same prefix, and it’s semantically wrong for causal spec-verify, which is what the production code actually does. I didn’t notice until I read <code class="language-plaintext highlighter-rouge">_prefill_attention</code> carefully. Always run against what the code does in production, not a convenient approximation that happens to share a function signature.</p>

<p><strong>Measure at the boundary that matters.</strong> Kernel-alone 2.9x and backend-boundary 2.04x are both real measurements, but only one is what users see. The gap is the production baseline’s batch-axis trick, which wasn’t visible from the kernel interface. A writeup that reports only the kernel number is overselling.</p>

<p><strong>Know your register budget.</strong> The autotune found nothing because BLOCK_KV, num_warps, and NUM_KV_SPLITS were all gated on the same per-thread register budget. When projected compounding wins fail to compound, something is gating all of them — usually a single resource like registers, SLM, or dispatch bandwidth. Check the gating resource before running the sweep.</p>

<p><strong>Negative results are worth writing down.</strong> The SYCL PoC returned NO-GO. Documenting why — and being specific about what would be needed to actually test the thesis — is more valuable than hiding it. The Triton profile that produced the 2x fix wouldn’t have happened without the SYCL NO-GO making me look harder at the Triton path.</p>

<h2 id="closing">Closing</h2>

<p>From NO-GO SYCL PoC to a 2.04x backend-layer speedup for the k3v4_nc preset, in two weeks. The fused-N_spec kernel is one file diff in <code class="language-plaintext highlighter-rouge">src/turboquant_xpu/kernels/triton_decode.py</code>, one integration gate in <code class="language-plaintext highlighter-rouge">patches/vllm_mounts/backends/turboquant_attn.py</code>, and three commits: <a href="https://github.com/bryanvine/turboquant-xpu/commit/425fc5c"><code class="language-plaintext highlighter-rouge">425fc5c</code></a>, <a href="https://github.com/bryanvine/turboquant-xpu/commit/c0a69a3"><code class="language-plaintext highlighter-rouge">c0a69a3</code></a>, <a href="https://github.com/bryanvine/turboquant-xpu/commit/9974d8e"><code class="language-plaintext highlighter-rouge">9974d8e</code></a>. The SYCL PoC is on the <code class="language-plaintext highlighter-rouge">sycl-poc</code> branch merged at <a href="https://github.com/bryanvine/turboquant-xpu/commit/796f7df"><code class="language-plaintext highlighter-rouge">796f7df</code></a>, preserved with its NO-GO note for if the libsycl ABI split ever resolves upstream.</p>

<p>The surprise was that the register file, not the arithmetic pipes, was the wall. Launch overhead was the obvious bottleneck and closing it drove most of the gain — but what now gates further fused-kernel wins is a resource that neither VTune nor a roofline plot points at. You learn that kind of thing by running the sweep and watching every knob fail in the same direction.</p>

<p>Intel is planning a SYCL port (<a href="https://github.com/vllm-project/vllm-xpu-kernels/issues/271">issue #271</a>); the Triton win is complementary and will eventually be superseded. Until then, <code class="language-plaintext highlighter-rouge">TQ_USE_FUSED_SPEC=1</code> is a 2x improvement on the preset that needed it most. Repo at <a href="https://github.com/bryanvine/turboquant-xpu">github.com/bryanvine/turboquant-xpu</a> with benchmarks and tests reproducible on a single B70.</p>]]></content><author><name>Bryan Vine</name></author><category term="intel-arc" /><category term="llm-inference" /><category term="kernels" /><category term="triton" /><category term="sycl" /><category term="speculative-decoding" /><category term="turboquant" /><category term="bmg-g31" /><category term="intel-arc-pro-b70" /><summary type="html"><![CDATA[TL;DR]]></summary><media:thumbnail xmlns:media="http://search.yahoo.com/mrss/" url="https://bryanvine.github.io/turboquant-xpu/og-turboquant.png" /><media:content medium="image" url="https://bryanvine.github.io/turboquant-xpu/og-turboquant.png" xmlns:media="http://search.yahoo.com/mrss/" /></entry></feed>